

Ethereum price falls below $2,600 amid geopolitical shock
Ethereum (ETH) slid below $2,600 on Oct. 7 as a sudden risk-off wave rippled through crypto markets. The move came after reports of escalating attacks on oil tankers near the Strait of Hormuz, stoking fears over global energy flows and triggering a broad sell-off in risk assets. At press time ETH traded around $2,565, down roughly 5% on the day from intraday highs near $2,700.
Traders and investors are now focused on a critical technical support band near $2,500–$2,560. Market participants are watching whether that zone can hold and preserve Ethereum’s recent bullish structure—or whether a deeper correction will follow that could pause any push toward the $3,000 level.
Macro catalyst: how oil and yields amplified the move
Global macro drivers intensified the sell-off. Brent crude pushed toward $101.50 per barrel as tanker attacks raised supply concerns, while the U.S. 10-year Treasury yield climbed to about 5.31%, boosting the appeal of government debt relative to riskier assets.
Combined with rising oil prices — which can feed inflation expectations — higher yields often reduce demand for risk assets such as Bitcoin and Ethereum. In this instance, Bitcoin tumbled from around $86,600 to a low near $83,060 on Oct. 7, including an aggressive $2,000 drop in just 30 minutes. That cascading reaction added downward pressure on altcoins, including ETH.
Liquidations and leverage accelerated the decline
Leverage magnified the sell-off. Market-data trackers reported more than $400 million in leveraged long positions liquidated during the Oct. 7 flush, forcing stop-losses and compounding downward momentum. Short-term liquidity clusters that had been concentrated around higher levels were swept as prices fell.
Ethereum’s one-week CoinGlass liquidation heatmap illustrates how the drop passed through multiple zones of concentrated leverage. Price has slid from roughly $2,700 into the mid-$2,500 area, with liquidity still visible around $2,640–$2,660 and larger clusters left above $2,700.
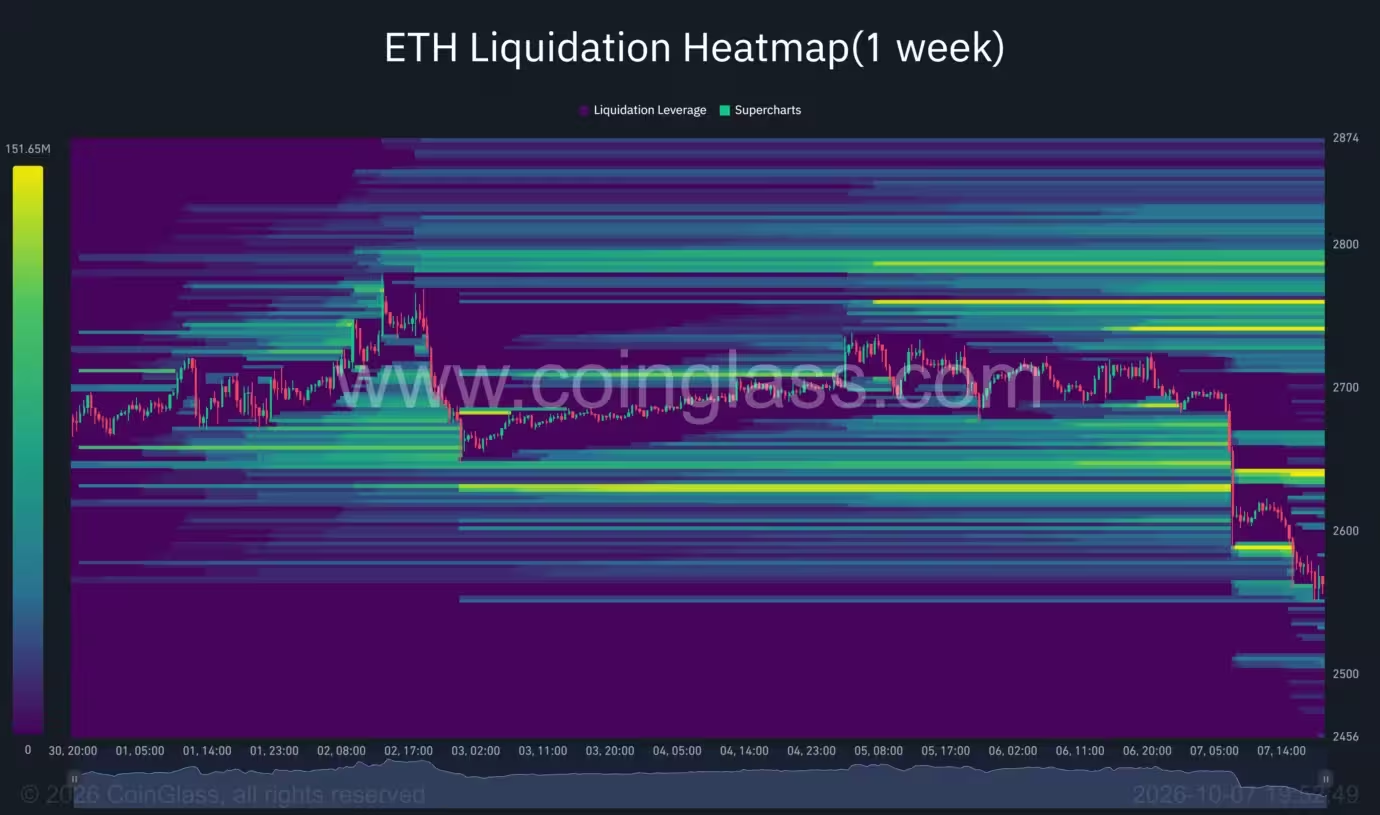
Ethereum liquidation heatmap
Technical picture: moving averages, RSI and Bollinger Bands
On the daily timeframe ETH has slipped below its 20-day simple moving average (SMA) at $2,684 after failing to extend September’s rally past the $2,800 area. That breach signals short-term weakness, although ETH remains above its longer-term averages: the 50-day SMA sits near $2,565, while the 100-day and 200-day SMAs are close to $2,199 and $2,128, respectively.
The convergence of price and the 50-day SMA makes the $2,550–$2,565 band the first major technical test. If buyers defend that area, ETH could stabilize and potentially retake recent resistance zones around $2,680–$2,800. A decisive daily close below the 50-day would, conversely, open the door to a deeper retracement and weaken the structure built during the August–September recovery.
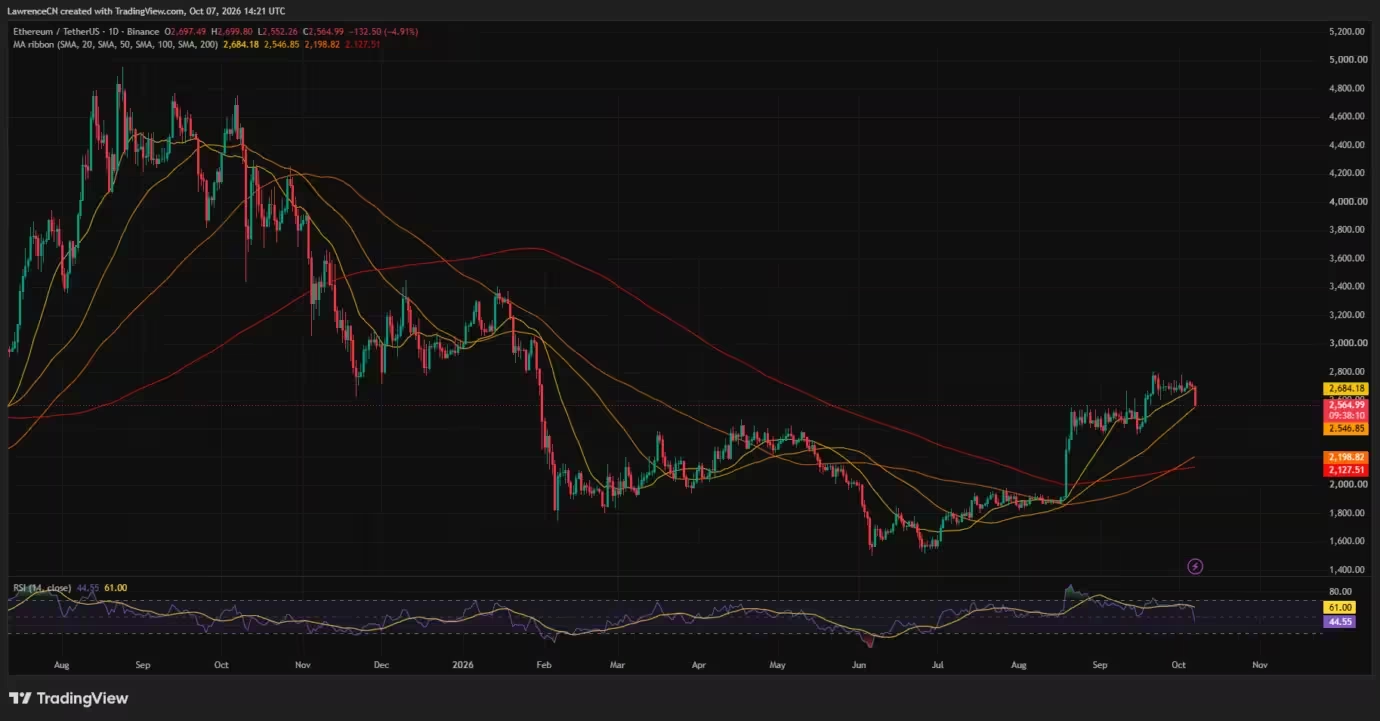
Ethereum price daily chart — Oct.7

Momentum indicators reflect the deteriorating bias. The daily relative strength index (RSI) has dropped to about 44.55, beneath the neutral 50 mark and well under recent readings near 61. The RSI is not yet in oversold territory, which leaves room for additional downside if sellers remain active.
On the 4-hour chart, ETH has slipped below the lower Bollinger Band (around $2,589), a sign of elevated short-term volatility. The middle band sits significantly higher at roughly $2,684, while the upper band approaches $2,780 — making the $2,680–$2,700 area a focal resistance on any rebound attempt.
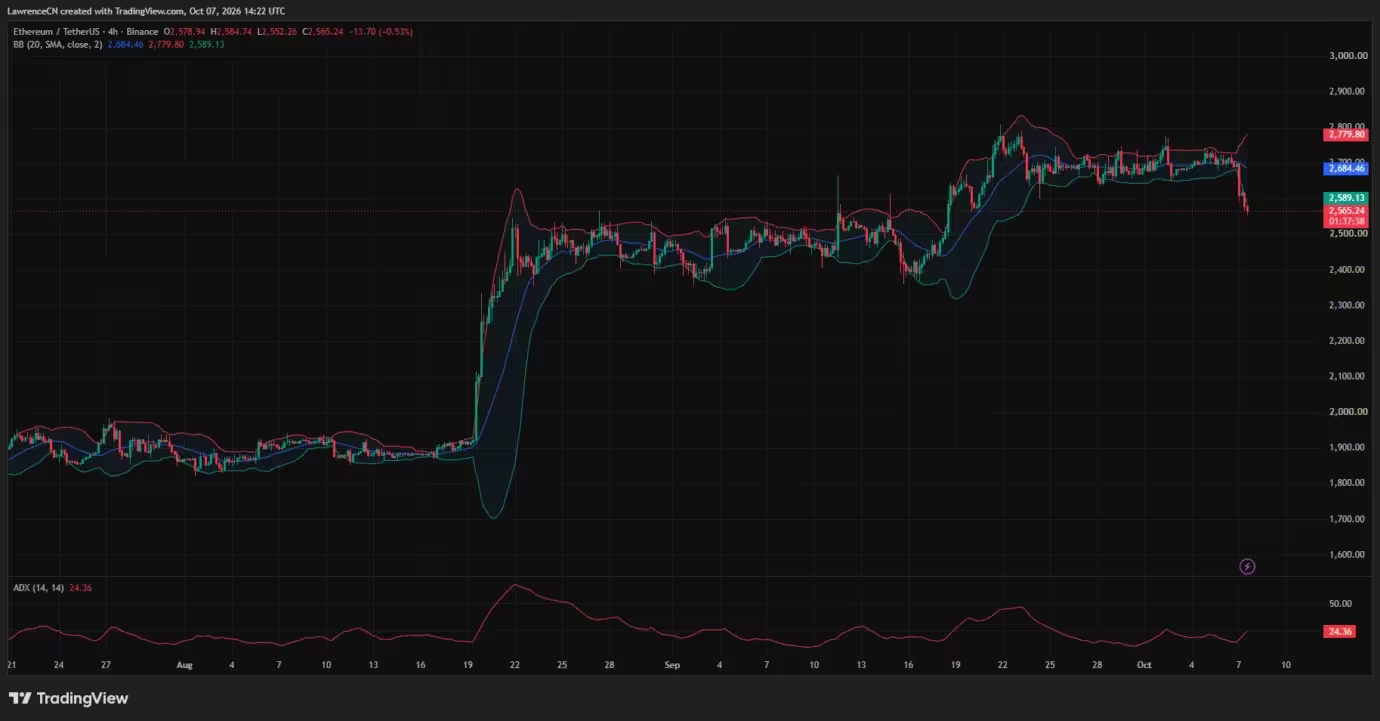
Ethereum price 4-hour chart — Oct. 7
The Average Directional Index (ADX) has risen to approximately 24.36, nearing the 25 threshold commonly associated with a strengthening trend. In this context, the ADX suggests the recent directional move is gaining conviction, at least in the short term.
Key technical levels to watch
- Immediate support: $2,500–$2,560 (50-day SMA confluence)
- Short-term resistance: $2,680–$2,800 (20-day SMA and upper Bollinger band region)
- Target on recovery: $3,000 (psychological and technical upside target)
Analyst views: defend $2,500 to keep bullish thesis alive
Several analysts have framed the pullback as a potential retest rather than a trend reversal. Crypto trader Merlijn The Trader described the drop as a retest of an earlier triangle breakout and highlighted the $2,500–$2,560 range as the pivotal area to defend. His view: if that zone holds, a renewed push toward $3,000 remains plausible.
"Hold $2,500–$2,560 and $3,000 is next," he commented, arguing the current dip sits near the former breakout level and could offer buyers a good risk/reward to re-enter.
Longer-term analyst Ted Pillows flagged the importance of weekly price structure. He noted ETH is approaching its 100-week exponential moving average (100W EMA), and that the next weekly close will be important for the broader trend. A sustained weekly close below the 100W EMA could open the door to a deeper correction, he warned.
The weekly timeframe therefore reinforces the tactical relevance of the $2,500–$2,600 zone: defending it would keep September’s breakout intact, while a clear breakdown could expose ETH to a larger retracement.
Outlook: scenarios for traders and investors
Bull case: Buyers hold $2,500–$2,560, reclaim the 20-day SMA near $2,684 and clear the $2,780–$2,800 supply zone. That sequence would revive momentum and set a path toward the next psychological target at $3,000.
Bear case: A decisive daily and weekly breakdown below $2,500–$2,560 would likely deepen the correction, target lower moving averages and draw out liquidation clusters left from the recent run-up.
Risk management remains essential in this environment. Elevated macro volatility, higher yields and concentrated leverage can produce fast moves in both directions. Traders should monitor liquidation levels, on-chain activity and macro headlines — including developments around the Strait of Hormuz — that could quickly shift market sentiment.
Bottom line
Ethereum sits at a technical crossroads after the Oct. 7 sell-off. The $2,500–$2,560 support band, anchored by the 50-day SMA and the prior breakout area, is the immediate line in the sand. Defending that range keeps the $3,000 recovery narrative alive; losing it on a sustained basis would increase the likelihood of a deeper correction. Given the current macro backdrop and concentrated leverage, market participants should expect continued volatility and trade with defined risk parameters.


Leave a Comment
Comments
No comments yet. Be the first.