

5 Minutes
Market snapshot: Bitcoin steady as equities hit records
Bitcoin (BTC) traded around $64,270 on Aug. 5, rising modestly by under 1% as a backdrop of record global equities and falling oil prices failed to ignite a broad crypto rally. While major stock indices such as the S&P 500 and Dow closed at fresh highs and Asian tech shares jumped on strong AI-driven earnings, crypto markets showed a muted response. Ether and XRP weakened, while BNB and Hyperliquid’s HYPE outperformed among large tokens.
Why cheaper oil and lower yields usually help BTC — and why they didn’t this time
Brent crude slid toward $78.85 as traders digested reports that the U.S., Iran, and Oman were close to a temporary shipping accord for the Strait of Hormuz. Simultaneously, the U.S. 10-year Treasury yield eased to roughly 4.603% as markets reduced the likelihood of another imminent Federal Reserve rate hike. Under normal conditions, lower oil prices can reduce inflation pressure and softer bond yields make non-interest-bearing assets like Bitcoin more attractive. Yet BTC’s limited upside across several sessions suggests crypto-specific demand remains weak and has not tracked the broader risk rally.
Geopolitical developments remain central
Axios reported diplomatic discussions aimed at reopening the Strait of Hormuz under a 60-day shipping arrangement, potentially extendable. President Donald Trump indicated a deal could be announced imminently, but no formal agreement had been published at the time of reporting, and key differences persisted between the U.S. and Iran. The market therefore remains exposed to renewed volatility if talks falter or attacks on shipping resume. Oil prices have already priced in some easing of tensions; the limited BTC reaction contrasts with larger moves in equities and crude.
ETF flows, corporate sales and supply dynamics
U.S. spot Bitcoin exchange-traded funds registered net inflows of $19.6 million on Aug. 4, according to Farside Investors. That positive session provided short-term support after heavier withdrawals earlier in the week — including about $265 million of redemptions reported on Aug. 1. Net ETF flows remain a closely watched driver of market liquidity and price direction for BTC.
Corporate sales remove price-insensitive holders
Corporate supply has also re-entered the market. Strategy’s official Bitcoin ledger shows the firm sold 1,638 BTC for roughly $105 million, leaving it with 842,138 BTC. While the sale is small relative to the company’s overall holdings, it removes a source of price-insensitive accumulation that helped sustain prior rallies. Further corporate liquidations would add downward pressure unless matched by renewed buying from ETFs, institutions, or retail investors.

Technical picture: $64,300 is the key breakout level
Technically, traders are focused on a four-hour setup that places $64,300 at the upper edge of a descending channel. Chart analyst Ali Martinez has highlighted that a four-hour close above $64,300 could confirm a breakout and open a path toward conditional targets at $65,500 and $66,500. Those targets should be treated as potential next resistance zones, not guaranteed outcomes.
Bollinger Bands and momentum indicators
On the daily chart, Bitcoin is trading near the Bollinger Bands middle line around $64,404. The upper band sits near $66,285 while the lower band is about $62,524, indicating consolidation rather than a decisive directional move. The Aroon Oscillator reads negative 71.43, signaling that recent lows have been more dominant than recent highs. Holding support in the $62,500–$63,000 range would preserve the current range; a daily close above $66,000–$66,300 would provide stronger evidence that buyers are regaining control.
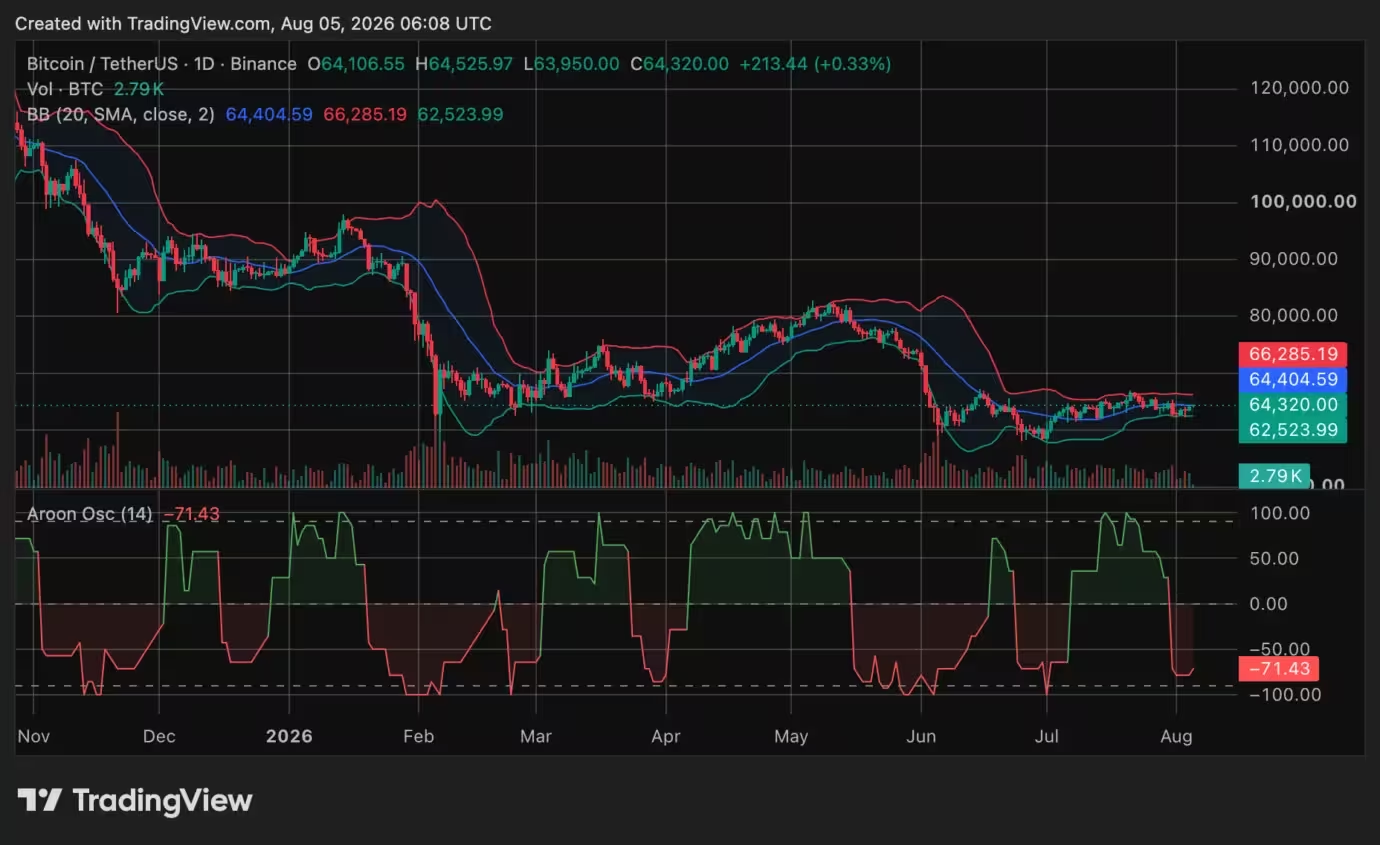
Bitcoin (BTC) price chart
What would confirm a trend reversal?
A confirmed diplomatic breakthrough on Hormuz that pushes BTC cleanly above $64,300 and through the upper Bollinger Band could mark a meaningful shift in market dynamics. Conversely, failure to rally after a verified deal would reinforce the idea that capital is rotating into AI equities, bonds, and gold rather than crypto. Volume expansion and sustained ETF inflows will be crucial to validate any breakout.
Key levels and scenarios to watch
- Immediate resistance: $64,300 (four-hour channel boundary) and $66,285 (upper Bollinger Band).
- Upside targets on confirmed breakout: $65,500 and $66,500 (conditional).
- Range support: roughly $62,524 to $62,500 — a daily close below this zone risks resumed downside pressure.
- Macro triggers: confirmed Hormuz agreement, shifts in U.S. 10-year yields, and continued ETF flow patterns.
Outlook: cautious optimism but not yet conviction
Bitcoin has recovered more than $2,000 from recent lows near $62,200, yet the rebound remains modest compared with the strength seen in global equities and crude. Until BTC posts higher-volume closes above key resistances and ETF flows stabilize into sustained inflows, the recent bounce looks more like a recovery within a broader downtrend than a confirmed reversal. Traders should also monitor corporate sales from large holders and any renewed geopolitical escalation that could quickly push BTC below $64,000.

In short, the next confirmed diplomatic update on the Strait of Hormuz, upcoming ETF flow data, and whether Strategy or other large holders report further disposals will determine whether BTC can build on the current stability or re-enter a deeper correction. For now, Bitcoin remains roughly flat over the past seven days and sits about 49% below its October 2025 peak above $126,000, underscoring the scale of the recovery required to reclaim prior highs.

Leave a Comment
Comments
No comments yet. Be the first.