

Market snapshot: ETH under pressure as institutions withdraw
Ethereum (ETH) has struggled to find footing this week, trading around $1,802.83 during Thursday’s session — down roughly 0.55% on the day and about 12.21% over the past seven days. Market capitalization sits near $220.36 billion with daily volume around $10.65 billion. The downturn comes as large traders and institutional holders reduce exposure while retail buyers hunt for dips.
Exchange reserves and liquidity: Binance at multi-year lows
Binance ETH reserves fall to levels not seen since 2020
CryptoOnchain data show Binance’s seven-day average Ethereum reserve declined to 2.97 million ETH through Nov. 17 — the lowest reading since November 2020. Over the last 30 days, Binance’s ETH holdings contracted by about 11.3%, far outpacing the 2.1% decline observed across all monitored exchanges, where combined balances totaled 14.54 million ETH. Coinbase’s balances remained relatively steady at roughly 3.13 million ETH.
That withdrawal trend has been ongoing: earlier reporting indicated Binance’s Ethereum reserves had fallen nearly 42% since July 2025. Compounding the signal, Binance’s seven-day USDT reserve on the Ethereum network also dropped to $29.71 billion, putting both ETH and stablecoin liquidity near multi-period lows and suggesting reduced buying capacity on the exchange.
Is the ETH moving to self-custody or staking?
Analysts note withdrawals may represent a mix of self-custody transfers, staking inflows, or funds exiting the exchange to private wallets. While some ETH could be moving off-exchange for staking or cold storage, definitive destinations remain unconfirmed. At the same time, Binance’s estimated leverage ratio sits at 0.84 even as open interest for Ethereum across platforms fell 18.2% to $9.53 billion — a dynamic that can amplify volatility if reserve declines continue.
Ethereum ETF outflows and corporate selling
Spot ETFs see continued redemptions
U.S. spot Ethereum ETFs recorded net outflows of $39.8 million on Nov. 18, marking their third consecutive session of withdrawals. According to Farside Investors, BlackRock’s ETHA saw $17.4 million in outflows while its staked ETH product lost $5.4 million. Grayscale’s two Ethereum products accounted for roughly $17 million of the net redemptions. Over the last five trading sessions, ETFs have seen $145.5 million exit, following heavier redemptions earlier in November when Ether ETFs lost $764.1 million in the first two weeks of the month.
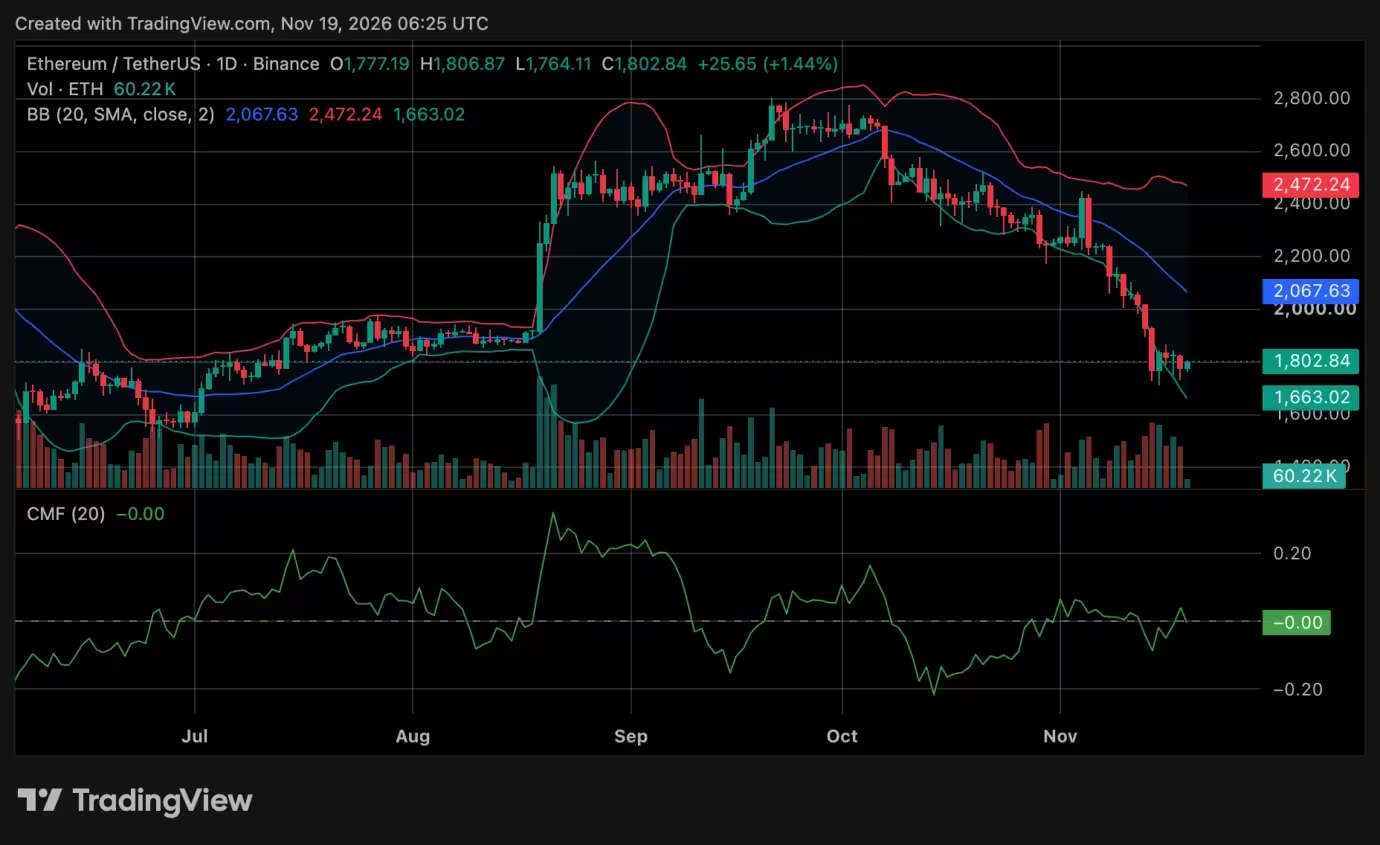
Ethereum price chart
Institutional selling has been mirrored by corporate treasury moves. Digital asset manager CoinShares announced it sold its entire Ethereum treasury position for $16.6 million and offloaded $2.7 million in Solana to support a $40 million share buyback program. These sales add to the supply-side pressure on ETH and underline how corporate decisions can influence market liquidity.

Macro backdrop: Fed policy concerns weigh on risk assets
Outside crypto markets, the Federal Reserve’s October meeting minutes signaled that most policymakers still expect further monetary tightening could be appropriate. Two participants even flagged that a rate increase exceeding 25 basis points could be considered in December if inflation prints remain unfavorable. Elevated rate-hike risk typically pressures risk assets, including cryptocurrencies, and may be contributing to the recent ETH weakness.
On-chain flows and trader behavior: whales selling, retail buying
Large trades reduce exposure while smaller buyers step in
Blockchain analytics from Alphractal and commentary by Joao Wedson point to a distribution pattern where large transactions — trades in the $100,000 to $10 million range — have been net sellers, while retail participants have continued to buy the dip. That split in behavior creates a tug-of-war: professional and large-scale traders trim risk, while smaller holders attempt to accumulate at lower prices.
Alphractal’s analysis also highlights concentrated liquidation clusters near $1,200 on Hyperliquid, signaling the possibility of deeper leveraged unwind if price momentum turns sharply lower. Wedson cautioned these clusters can dissipate quickly, which may reduce downside pressure if positions are closed or restructured before such levels are tested.
Technical picture: key support and potential targets
Bollinger Bands, moving averages and support zones
On the daily chart, Ethereum has been making lower highs and lower lows since early October, and volatility appears to be expanding as Bollinger Bands widen. ETH remains below its declining 20-day simple moving average, near $2,067.63. The lower Bollinger Band sits near $1,663, offering a possible short-term downside buffer if ETH fails to hold recent lows around $1,734.
Immediate resistance should a rebound begin emerges at $1,817; clearing that level could place $2,000 and the 20-day SMA back into focus. Meanwhile, some analysts point to a longer-term ascending channel whose lower boundary Ethereum recently revisited; the next weekly candle may help clarify whether that historical support holds.
Historical accumulation and longer-term outlook
Crypto analyst Crypto Patel identifies a broader historical accumulation zone between $1,000 and $1,500, with $1,000 representing a critical long-term support. If macro conditions deteriorate or leverage-driven liquidations intensify, ETH could test that range. Conversely, Patel’s multiyear forecast still envisions expansion targets between $10,000 and $16,000 in the 2027–2028 cycle, contingent on macro normalization, renewed institutional demand, and broader crypto market recovery.
What traders and investors should watch
- Exchange reserves: further declines in Binance or other exchange ETH/stablecoin balances could signal reduced buy-side capacity.
- ETF flows: continued redemptions would maintain selling pressure, while inflows could help stabilize price.
- Macro data and Fed commentary: inflation prints and Fed guidance remain key drivers for risk appetite.
- On-chain liquidation clusters: watch leverage concentrations around $1,200 for potential cascade risk.
- Technical levels: $1,663 (lower Bollinger Band), $1,734 (recent low), $1,817 (near-term resistance), and the $1,000–$1,500 historic accumulation zone.
In short, Ethereum’s near-term trajectory will be shaped by a mix of on-chain flows, institutional demand, ETF dynamics, and macro policy signals. Retail buyers continue to scoop up dips, but with whales and large traders trimming exposure and liquidity on some exchanges near multi-year lows, downside risks remain meaningful until clear buying pressure reappears.


Leave a Comment
Comments (1)
Wow, Binance reserves at 2020 levels? If thats true, big whales moving ETH off exchange. Retail grabbing dips, volatility incoming...