

Bitcoin outlook: recovery attempt meets lingering selling pressure
Bitcoin (BTC) staged a modest recovery to roughly $65,000 on Monday, November 16, after plunging toward $62,000 over the weekend. Despite the bounce, traders and analysts remain split on whether the largest cryptocurrency has finished a deleveraging cycle or if further downside toward $60,000 is still likely. Market metrics such as liquidations, open interest, funding rates and spot ETF flows are now central to the debate about whether BTC can sustain a renewed rally or will revisit summer lows.
Key takeaways
- Bitcoin recovered to about $65,000 after falling under $62,000 during a weekend selloff.
- BTC remains below its 20-day simple moving average and faces resistance near $65,400 to $70,000.
- Cryptocurrency liquidations eased to around $242.6 million following a near $2 billion liquidation wave.
- CryptoQuant data showed declining open interest and negative funding rates, signaling a leverage reset but not an obvious bottom.
- US spot Bitcoin ETFs recorded roughly $1.91 billion in withdrawals across seven sessions, complicating near-term demand expectations.

Price action and technical picture
At the time of writing, Bitcoin was trading near $64,800, more than 13% lower over the past week. The deterioration accelerated after early November, when BTC was trading around $81,000. Sunday’s crash pushed prices closer to $62,000 before a partial rebound reclaimed the $65,000 area. However, recovery momentum is fragile because BTC is still below the 20-day simple moving average, which sits near $74,370, and technical indicators are signaling continued selling pressure.
Bollinger Bands place the lower band roughly at $64,571, nearly identical to the current market price, and a negative Bollinger Band Power reading suggests volatility is biased toward the downside. For a more sustained upside, traders will be watching $65,400 as the first resistance level. If bulls can clear that hurdle, the next meaningful zones are $68,000 and the $69,000 to $70,000 range — levels that some prominent traders say will determine whether the recent selloff is a shakeout or the start of a deeper correction.
On the downside, immediate support sits around $64,500 and the weekend low near $62,000. A decisive break below $62,000 would open the path toward $60,000, with the summer low near $59,000 representing a longer-term reference point for risk managers and long-term holders.
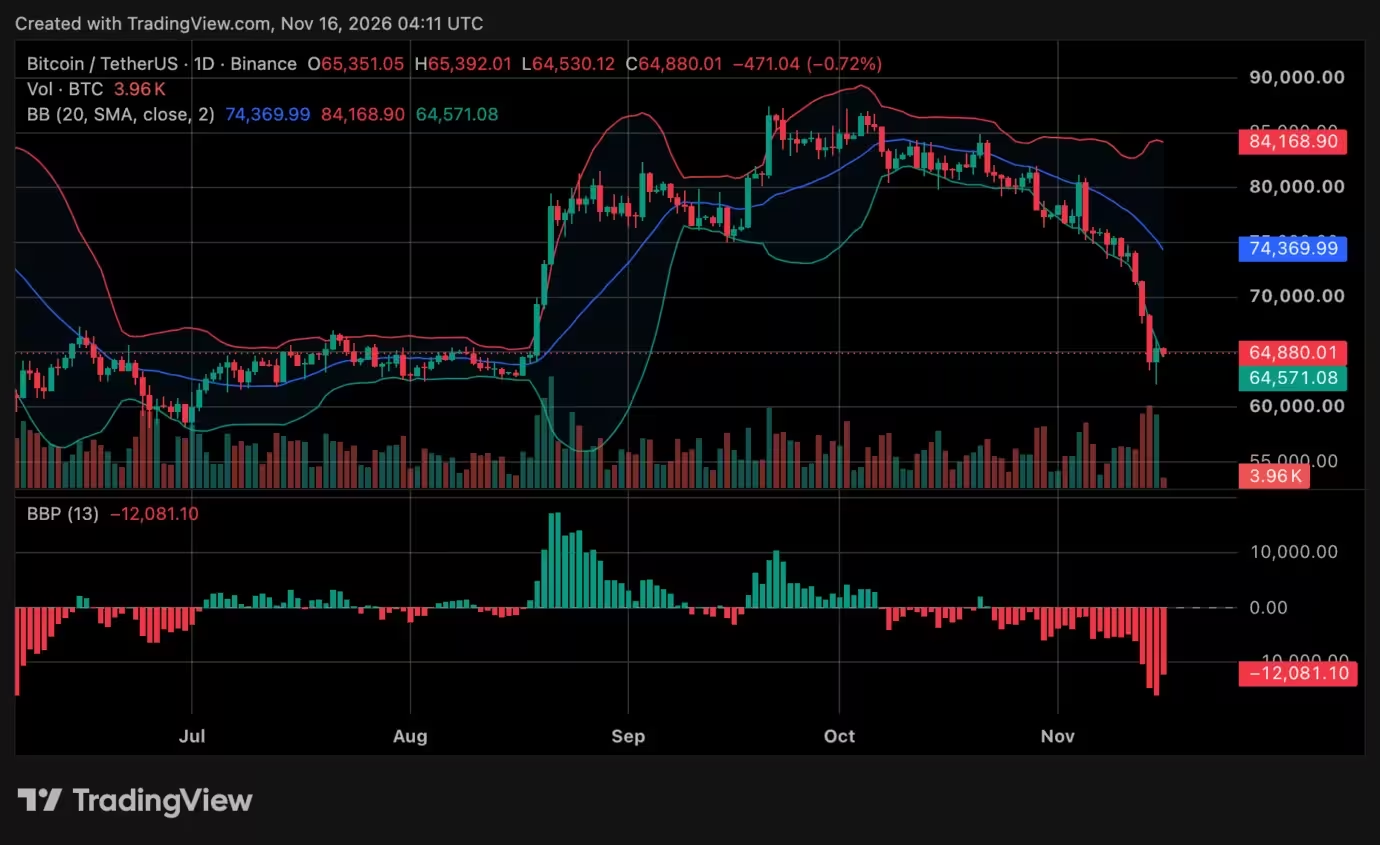
Bitcoin price chart

Liquidations and leverage: is the flush complete?
The weekend slump generated close to $1.96 billion in liquidations across the crypto market, including roughly $600 million in Bitcoin long liquidations. CoinGlass later reported that the rolling 24-hour total had cooled to about $242.63 million across nearly 66,000 traders, reflecting how the initial liquidation spike left the measurement window.
In the more recent rolling period, Bitcoin accounted for approximately $107 million in liquidations, where short positions made up nearly $69 million versus around $39 million in long liquidations — an indication that some traders had been caught betting on further declines.
CryptoQuant contributors noted that open interest in coin-margined BTC-USD contracts fell from roughly $1.55 billion to $1.1 billion as prices slid from $74,000 to $64,000. Funding rates have turned negative for the first time since March, consistent with periods when leveraged buyers reversed course and markets searched for a local bottom. Analysts compared the dynamic to earlier flushes in February and June when contractions in leverage accompanied temporary lows.
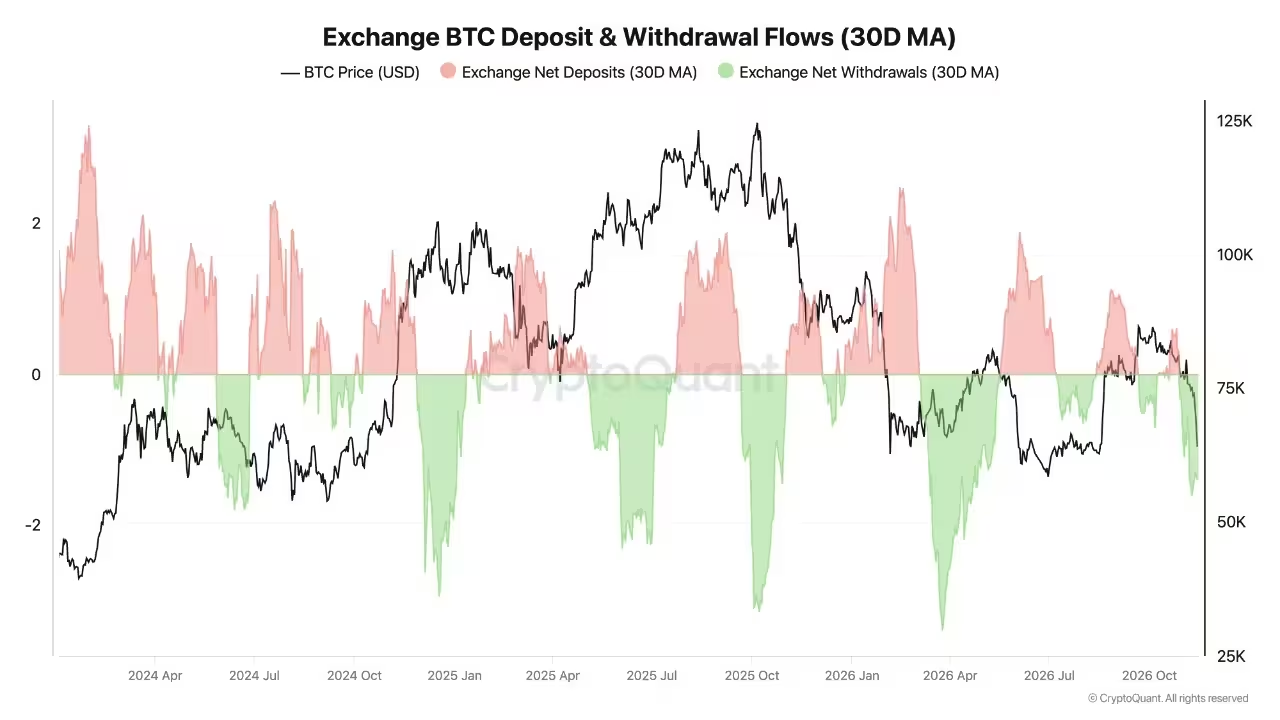
What the leverage reset means
Lower open interest and negative funding can indicate that a significant amount of speculative leverage has been removed from the market, which sometimes precedes consolidation or a recovery. Yet, analysts warn that an increase in short exposure and continued heavy selling could prolong volatility and push prices toward the next downside cluster around $59,000 to $60,000 if sellers reassert control.
Spot ETF flows and exchange activity: demand signals to watch
Demand dynamics in US-listed spot Bitcoin ETFs have been a focal point. Farside Investors tracked roughly $1.91 billion in outflows over seven straight trading sessions leading up to November 13. Notable withdrawals included $143.5 million from BlackRock’s IBIT and $41.9 million from Fidelity’s FBTC on the Friday before the weekend crash. These redemptions likely added to selling pressure, especially since some of the outflows occurred during the most acute phase of the selloff.

Meanwhile, the Coinbase premium — the gap between Coinbase and Binance BTC pricing — remained negative for an extended period, pointing to relatively weaker US spot demand. CryptoQuant analysts cautioned that while large exchange outflows have historically preceded rallies, outflows alone are not a substitute for broad-based spot buying, and they do not guarantee an immediate bottom.
Macro events and catalysts ahead
Near-term macro and corporate events could further shape BTC price direction. Nvidia’s third-quarter earnings call and Anthropic’s IPO pricing are scheduled this week, both of which can influence risk appetite across technology and AI-linked investments. The Federal Reserve will also publish minutes from its October 27–28 policy meeting, a release that traders often scrutinize for clues on future interest-rate expectations and dollar strength.
Binance’s leadership described the recent selling as a normal market response to tighter macro conditions, while exchange flow analysis suggested heavier net spot selling on a dollar-denominated platform versus Binance. Combined, these signals underscore the cross-asset nature of the move and why Bitcoin’s near-term path remains tied to broader liquidity and sentiment factors.
Trading implications: paths for bulls and bears
For bullish scenarios to resume, BTC needs to clear the $65,400 resistance and then push through $68,000 and $69,000–$70,000. A decisive reclaim of those levels would reduce immediate downside risk and could draw buyers back into spot ETFs and derivatives. Conversely, failure to hold $62,000 would likely accelerate stops and could expose $60,000 and the $59,000 summer low as the next targets for sellers and short-term risk managers.
In the short run, traders should monitor liquidations, funding rates, and ETF flows as leading indicators of leverage and real-money demand. Events such as Nvidia earnings and Fed minutes can amplify volatility, creating sharp intraday moves that traders and investors should factor into position sizing and risk controls.
Ultimately, Bitcoin remains at an inflection point where macro conditions, ETF demand, and a recent deleveraging wave will determine whether the market consolidates and rebuilds or continues a deeper correction toward $60,000.


Leave a Comment
Comments (2)
wild week... drop from 81k to 64k in days, not convinced it's over, spot flows look weak, need clear reclaim of 69 70k imo
Hmm liquidations eased but ETFs pulling cash? feels shaky, is $60k really next stop or just panic sell?