

Bitcoin sinks to three-month low as ETF outflows, liquidations accelerate
Bitcoin tumbled to a three-month low near $62,000 on November 15, extending a sharp weekly decline and reigniting concerns across the crypto market. Continued withdrawals from US spot Bitcoin ETFs and a round of heavy leveraged liquidations pushed BTC lower, with other major tokens including Ethereum, XRP and Solana also suffering losses.
The flagship cryptocurrency traded around $64,500 according to crypto.news pricing data after touching an intraday low near $62,080. Over the prior seven days BTC lost nearly 15%, sliding further after it fell below the $70,000 mark on Friday.
ETF outflows: $1.91 billion pulled in seven sessions
One of the main pressure points has been net redemptions from US spot Bitcoin ETFs. Data from Farside Investors shows roughly $1.91 billion in withdrawals took place across seven consecutive trading sessions between November 5 and November 13. The funds reported another $185.4 million in outflows on Friday alone, including $143.5 million from BlackRock’s iShares Bitcoin Trust (IBIT) and $41.9 million from Fidelity’s Wise Origin Bitcoin Fund (FBTC). Midweek outflows had previously included $299.8 million and $284.1 million, compounding selling pressure.
Spot Bitcoin ETFs do not report flows over the weekend, so the next daily flow update was due after the US market reopened on Monday, November 16. Institutional selling amid ETF redemptions has been a key factor in the recent BTC price action, as funds moved to meet redemption requests and reallocated risk.
Leveraged liquidations near $750 million
The price slide was accompanied by a significant purge of leveraged positions. CoinGlass reported around $1.96 billion in total crypto liquidations over a rolling 24-hour window, with Bitcoin accounting for roughly $750 million of that total.
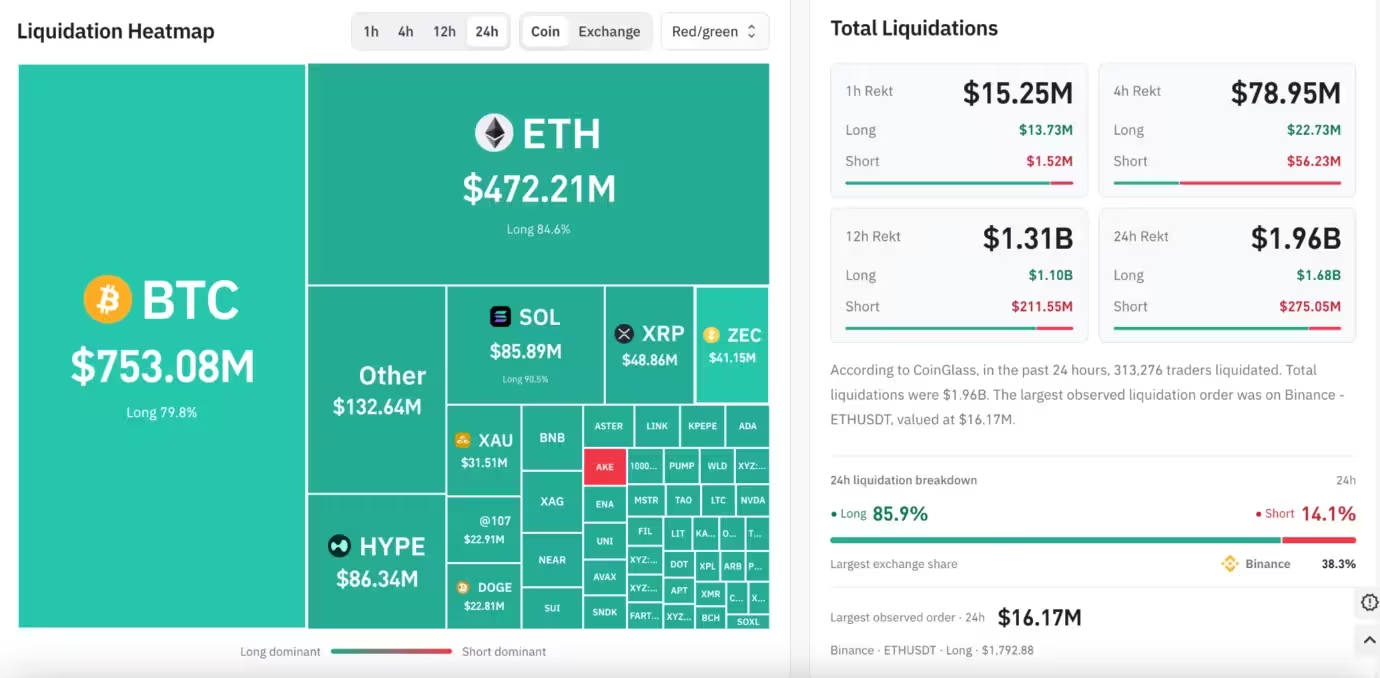
Almost $600.5 million of the BTC liquidations were long positions—about 80% of the Bitcoin total—while shorts made up roughly $152 million. Long liquidations happen when traders betting on higher prices fail to maintain required collateral and exchanges forcibly close positions, adding selling pressure and exacerbating declines. The latest event followed a previous wave of leveraged losses on November 13, when BTC first breached $70,000 and over $1 billion in leveraged crypto positions were liquidated.
Why leveraged selling matters
When long positions cascade, forced sell orders can accelerate downside momentum and amplify volatility. For spot and derivatives markets alike, large liquidation events can overwhelm bid liquidity, creating deeper intraday drawdowns and feeding chart-based stop-loss cascades.

Analysts call the selloff unusually severe but some are buying
Crypto analysts described the correction as extreme compared with typical pullbacks. Michaël van de Poppe flagged the degree of the move relative to Bitcoin’s 21-day and 200-day moving averages, calling it a “super rare, leverage-flush-driven correction.” He compared the three-day drop to historically notable selloffs such as the COVID crash and the FTX collapse, and said the current volatility pattern has only occurred a few times a year.
Van de Poppe noted the rarity of this type of decline and signaled he was adding to positions at current levels. Other analysts retained medium- to long-term bullish views even as they acknowledged short-term risk. Doctor Profit reiterated a bear-market threshold near $57,000, saying sellers would only take control if BTC fell below that level. Meanwhile, Daan Crypto Trades pointed to the broader four-year cycle in Bitcoin’s history, noting no two consecutive calendar-year losses to date, though he cautioned that historical patterns are an imperfect guide.
Technical picture: oversold but momentum remains bearish
Technical indicators signal the market is oversold but not yet reversing. Bitcoin has dipped below its 200-week moving average (near $67,992 as of November 14) and traded close to $62,000 before a partial recovery above $64,000. The daily relative strength index (RSI) sat at about 22.51, indicating oversold conditions. Meanwhile, the MACD remained negative, with a histogram reading near -1,182.17—suggesting bearish momentum has not fully cooled off.
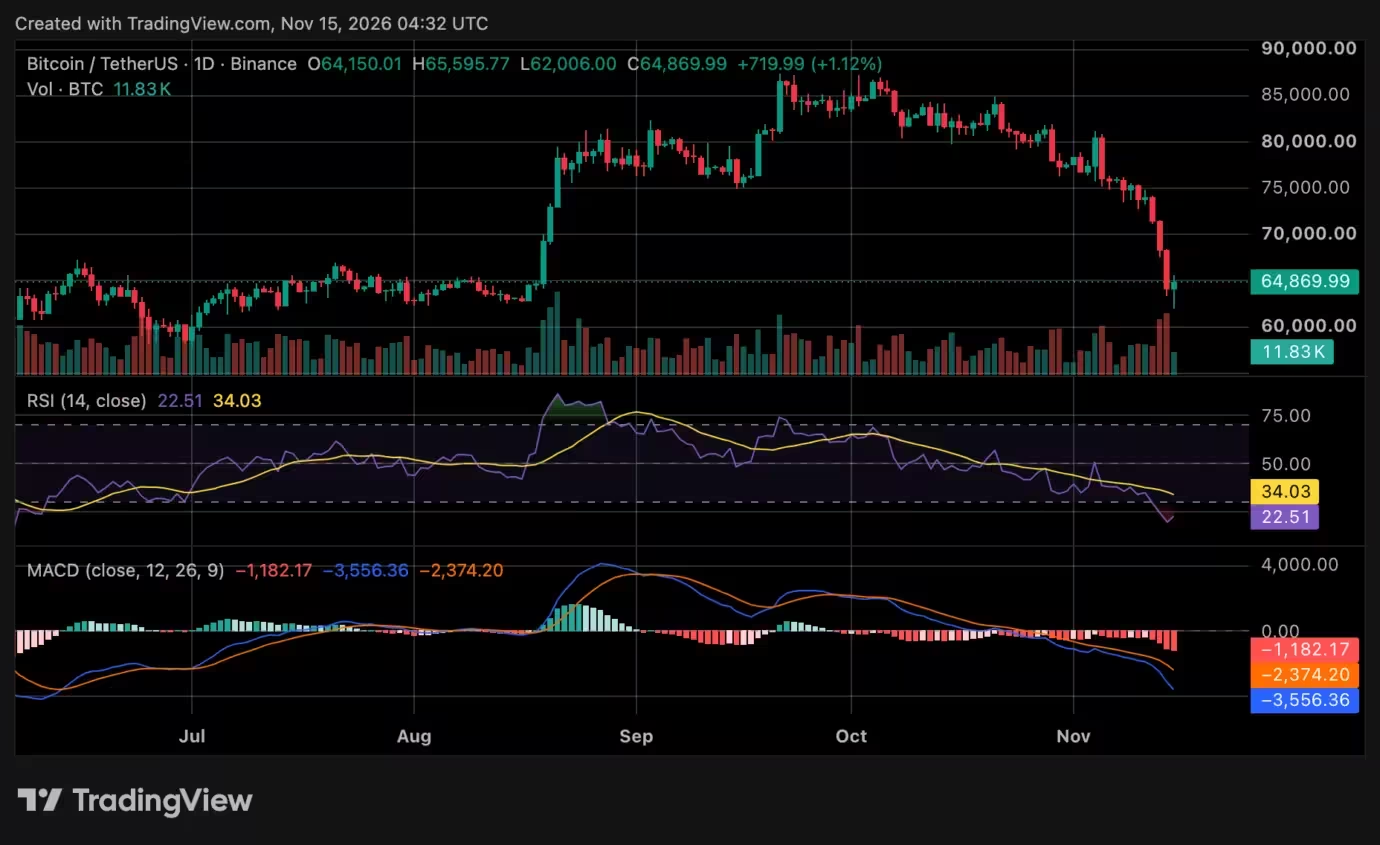
Bitcoin price chart
Immediate support for BTC is visible around $62,000. If selling intensifies, the $60,000 area and roughly $59,800 are the next downside targets. On the upside, reclaiming $65,600 would be an initial bullish signal, and a sustained move above the $68,000–$70,000 zone would restore a healthier short-term price structure. Until those resistance levels are cleared, traders should expect heightened volatility and potential for further forced liquidations.
Macro backdrop: inflation and rate concerns
Broader macroeconomic factors added to market fragility. October’s consumer price index showed a 0.4% month-over-month rise and core inflation increased by 0.3%, keeping the Federal Reserve’s interest-rate outlook in focus. Elevated inflation readings fueled concern that borrowing costs might remain higher for longer, dampening risk appetite across equities and crypto.
What traders and investors should watch next
- ETF flows: Daily spot ETF inflows and outflows will remain a primary driver of market liquidity and price direction.
- Liquidations and leverage: Watch open interest and liquidation metrics—another cascade of long liquidations could push prices lower quickly.
- Key technical levels: Support near $62,000 and $60,000; resistance at $65,600 and the $68k–$70k band.
- Macro data: CPI prints and Fed commentary that affect risk-on/risk-off positioning.
Bottom line: Bitcoin’s plunge to a three-month low has combined ETF redemptions, heavy long liquidations and macro uncertainty. While some analysts see buying opportunities at these levels, the technical and macro backdrop suggests more volatility ahead. Traders should manage risk carefully and monitor ETF flows, leverage metrics and key support/resistance levels to navigate the near-term market environment.


Leave a Comment
Comments
No comments yet. Be the first.