

Market snapshot: recent rebound and lingering resistance
Bitcoin's price has recovered from a liquidation-driven collapse, trading back toward $82,800 after briefly touching lows near $80,400. Across the seven-day window measured by CoinGecko, BTC sits around $82,726, roughly 2.9% above the period low but still well short of the overhead resistance that capped several rallies in late September and early October.
Daily momentum has cooled compared with the September advance: the relative strength index (RSI) stands at 50.97, while price remains below the 20-day Bollinger Band midpoint at $84,396. Short-term indicators show a bounce to the 20-period simple moving average on the 4-hour chart, but several longer moving averages and a cluster of technical resistance are stacked above.
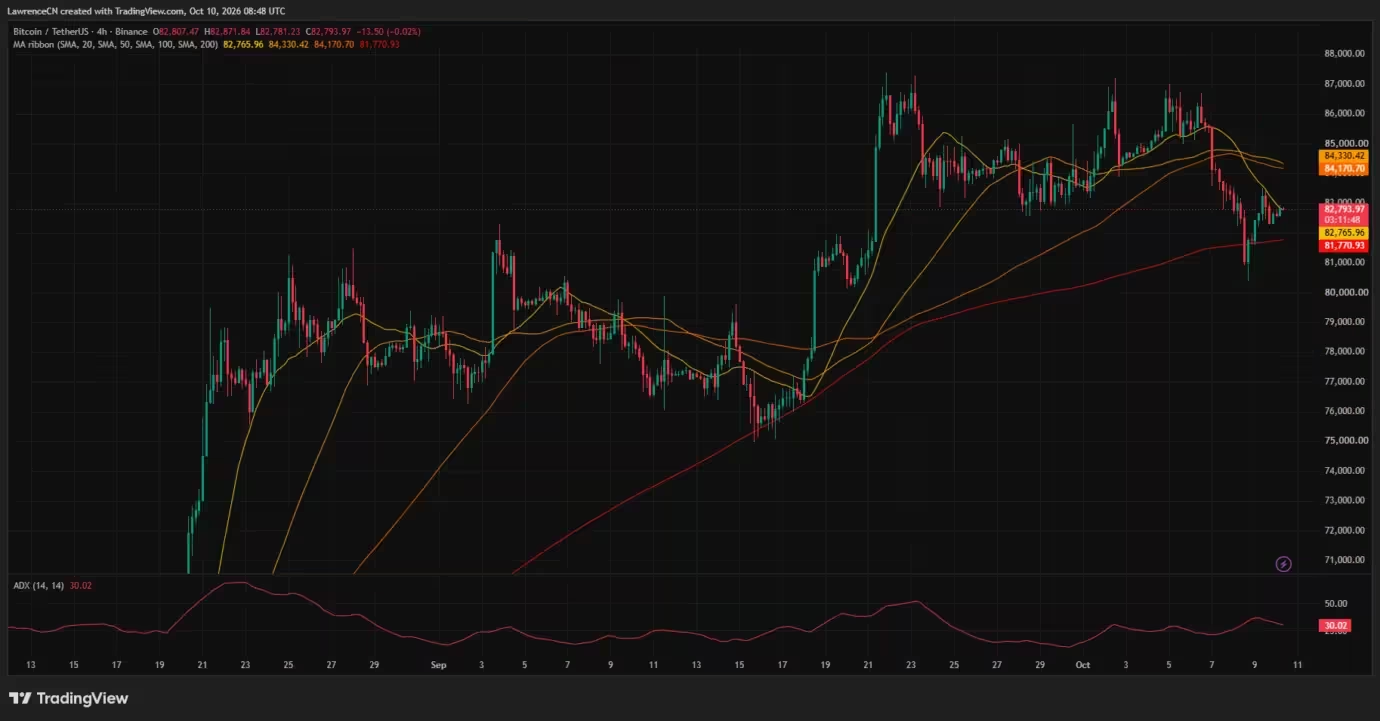
Bitcoin price 4-hour chart — Oct. 10
Technical levels: where resistance and support converge
On the 4-hour chart, BTC is trading just above the 20-period simple moving average at about $82,766, reflecting the immediate recovery since the sharp sell-off from the $86k–$87k region. However, traders face a compact resistance band: TradingView places the 100-period moving average near $84,171 and the 50-period average at about $84,330 — putting the first significant supply zone roughly 1.7%–1.9% above the current price.
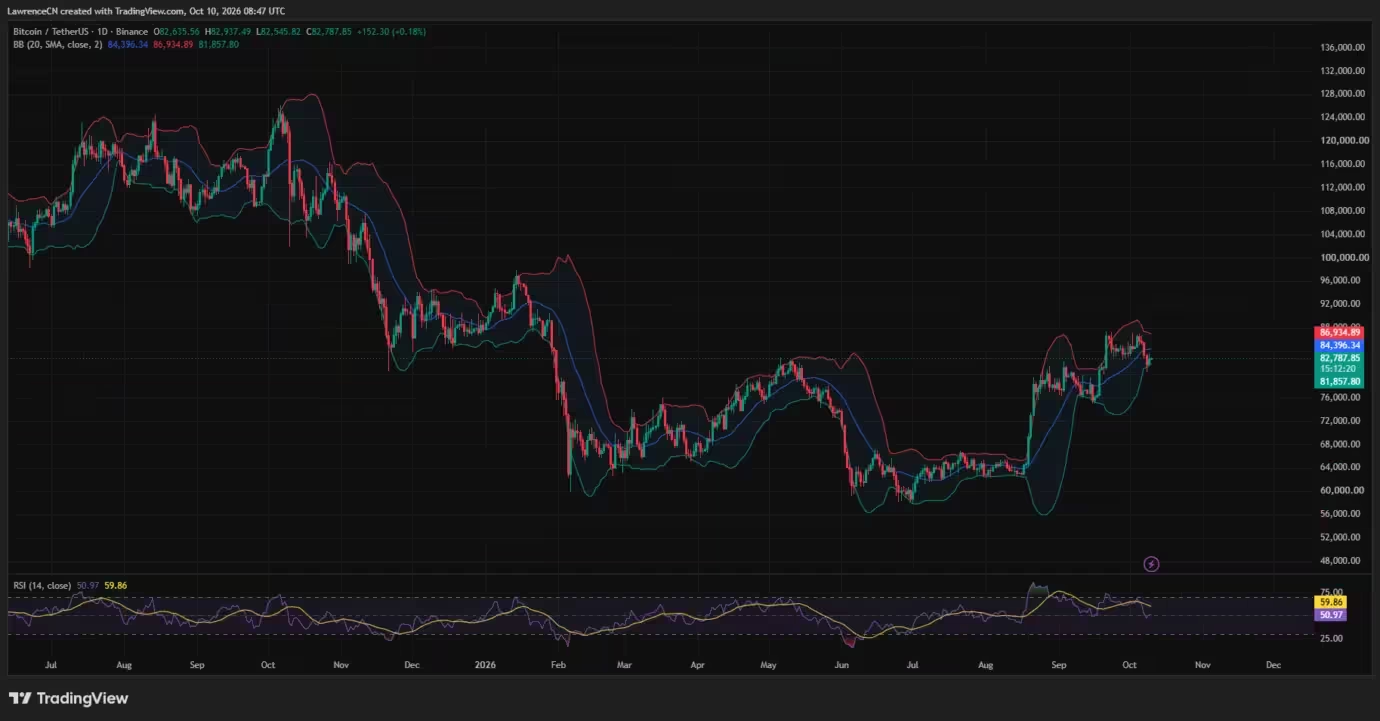
Bitcoin price daily chart — Oct. 10
The daily Bollinger Band midpoint (the 20-day moving average) sits at $84,396, almost directly above the two shorter 4-hour averages. That alignment creates a resistance corridor spanning roughly $84,170–$84,400. If BTC clears that area, the daily upper Bollinger Band at $86,935 reintroduces the $87,000 level as the next logical upside target — a band that repeatedly capped prior advances.

On the downside, the 4-hour 200-period moving average is near $81,771 while the daily lower Bollinger Band sits at $81,858, concentrating immediate technical support in the $81,700–$81,900 zone. Beneath that lies the recent $80,400 low, which would open the door to further downside if breached.
Liquidations and heatmap: where stops and liquidity cluster
A brutal liquidation event produced about $1.09 billion in crypto liquidations within a 24-hour window ending Oct. 9, according to CoinGlass. Long positions comprised roughly $1.05 billion of those liquidations, underscoring the scale of leveraged exposure that was wiped out during the plunge. That forced many traders out near the lows and amplified volatility as bids thinned.
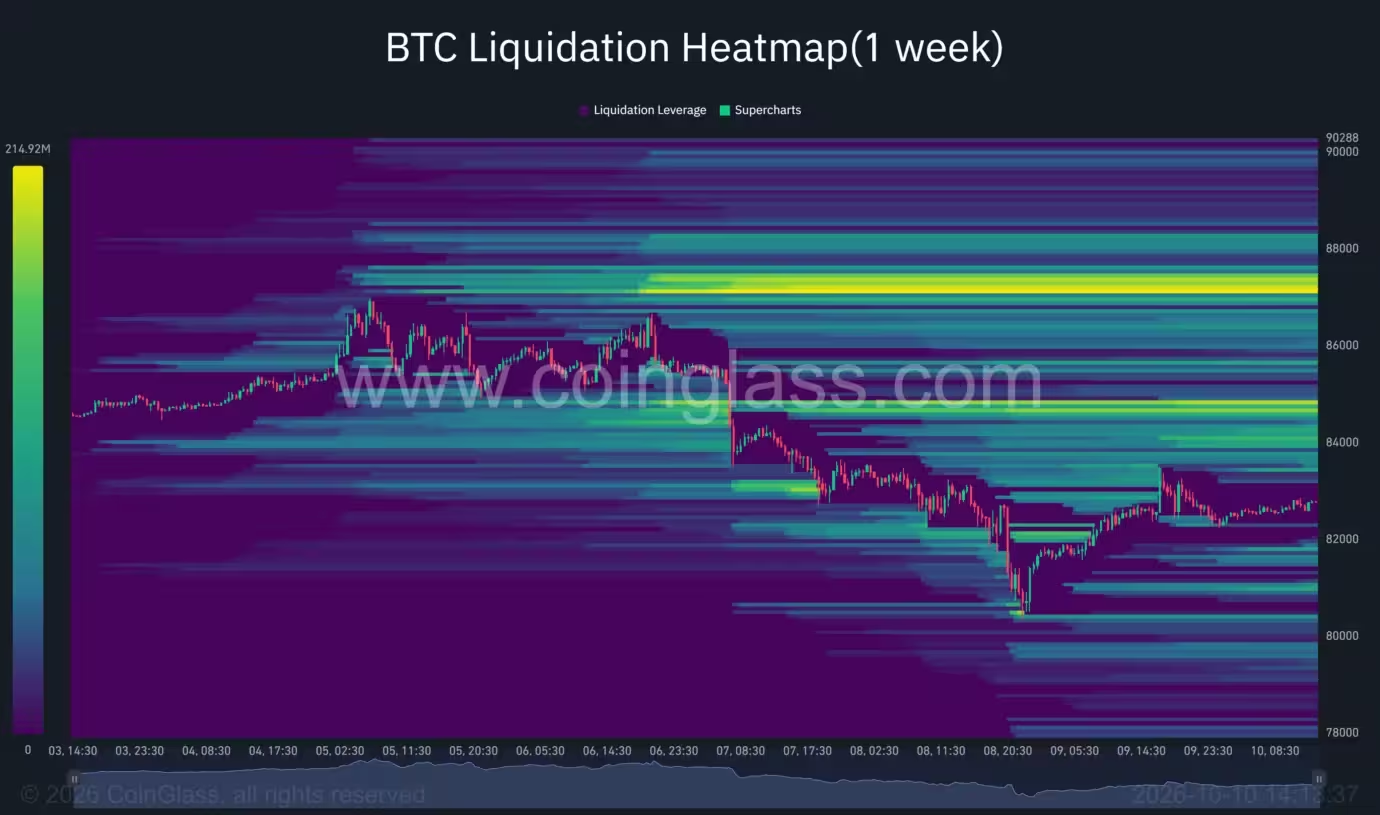
Bitcoin liquidation heatmap
CoinGlass’s weekly liquidation heatmap shows the brightest overhead clusters clustered between $87,000–$87,300, with additional bands near $84,700–$84,800 and visible concentrations around $84,000 and $88,000. Those elevated liquidation zones align with the technical resistance levels identified on TradingView and explain why price struggled to gain traction on prior rallies.
Below the market, the heatmap highlights liquidity pockets near $81,600, $81,000 and $80,400 — levels that correspond with moving-average support and the recent intraweek low. The on-chart route toward $87,000 therefore runs through the $84k–$85k bands first; failing to reclaim those zones would leave BTC vulnerable to another descent toward low-$80k and potentially sub-$80k levels.
Trader viewpoints and key support to watch
Technical traders have pinpointed a handful of critical levels that will likely determine whether this rebound becomes a sustained recovery or a short-lived bounce. Lennaert Snyder, a market analyst active on public social channels, identified $81,100 as the last meaningful support that would need to hold for a higher-timeframe reversal to gain credibility. Snyder’s base case requires price to hold the recent lows and clear near-term resistance between $84,000–$85,000 before attempting another run at $87,000.
Snyder also warned that weekend moves tend to be less reliable and frequently reverse during the following week — advice echoed by many professional traders who view lower weekend liquidity as a contributor to false breakouts. He charted the recent low near $80,400 and said that retaining that level into the week would improve the odds of a successful rally toward the liquidity zone around $87,000. Conversely, surrendering $80,400 would open the path to deeper declines and create potential opportunities for entries below $80k.

Spot Bitcoin ETF flows: outflows remain material
U.S. spot Bitcoin ETFs recorded meaningful net outflows totaling $678.9 million over the five trading sessions from Oct. 5–9, per daily tallies from Farside Investors. The biggest single-day withdrawal occurred on Oct. 7, when funds experienced $484.9 million in net outflows. BlackRock’s IBIT led losses that day with $207.7 million withdrawn, Fidelity’s FBTC saw $105.1 million removed, and ARK/21Shares’ ARKB had about $101.7 million of redemptions.
Another $244.1 million left the funds on Oct. 8, driven largely by $197.1 million of outflows from FBTC. Friday saw a small reversal, with $21.1 million in net inflows — including a $22.4 million injection into IBIT — coinciding with Bitcoin’s short-term recovery. Despite the one-day inflow, the weekly balance remained negative and continues to weigh on broader sentiment.
What this means for traders and investors
For short-term traders, the immediate picture is a battle between pressure from concentrated overhead liquidity and fragile support clustered in the low-$81k region. A decisive break above the $84k–$85k corridor would likely trigger cascade buying toward the $86k–$87k band, where visible liquidation clusters and prior rejections remain significant obstacles.
On the flip side, losing the $81,100–$80,400 area would increase the probability of a retracement below $80,000, attract fresh stop-hunting, and create a lower-risk entry zone for longer-term traders seeking a deeper pullback.
Fundamental considerations — including continued flows into or out of spot Bitcoin ETFs, macro risk appetite, and on-chain activity — will interact with the technical landscape to set the next directional phase. Market participants should weigh liquidity conditions, monitor moving averages and Bollinger Band midpoints, and account for the elevated possibility of weekend-induced whipsaws.
Outlook: conditional path to $87K, risk of another leg down
Bitcoin’s short-term path is conditional. If BTC can clear the nested resistance cluster around $84,170–$84,400 and sustain momentum, the daily upper Bollinger Band near $86,935 could become the next realistic objective, aligning with the CoinGlass liquidation band around $87,000. If that barrier proves insurmountable or if spot ETF outflows accelerate, the market risks sliding back toward the recent low and potentially below $80k.
Traders and investors should therefore treat the current bounce as tentative until price proves it can hold key support levels and absorb the visible overhead liquidity. Managing leverage, respecting confirmed support, and watching ETF flows and liquidation heatmaps will be critical for navigating the weeks ahead.


Leave a Comment
Comments
No comments yet. Be the first.