

Market snapshot: ADA slips back under $0.24
Cardano (ADA) has reversed its early-October rally, trading below the $0.24 mark and drawing attention to the $0.21 level flagged by several analysts. After a sharp weekly swing from a high near $0.2824 to a low around $0.2238, ADA sits close to $0.236 and shows signs of weakening momentum across daily indicators. Traders and investors monitoring Cardano price action should weigh short-term technical risks against the longer-term recovery from midyear lows around $0.14–$0.15.
Price action and recent range
Since the weekly peak, Cardano has lost roughly 16.5%, and the partial bounce from the weekly low has been insufficient to erase the decline. On the daily timeframe ADA traded between $0.2313 and $0.2415, with a modest intraday recovery after the sell-off. Measured moves project that a decline from the current mid-$0.23s into $0.21 territory would represent about an 11% drop from the latest level, with the recent weekly low of $0.2238 acting as an intermediary support.
Key intraday references
- Immediate resistance: $0.24 and the daily midpoint at $0.2483
- Nearby supports: $0.2276 (lower Bollinger band) and $0.2238 (weekly low)
- Conditional downside target: $0.21, identified on channel rejection analysis
Technical indicators: RSI and Bollinger Bands
Daily technicals show the relative strength index (RSI) dipping below neutral territory to about 48.06, signaling that momentum has turned slightly bearish on the short timeframe. The RSI also sits below its moving average reading, which reinforces the recent loss of upward momentum after early-October strength.
Bollinger Bands show the 20-day simple moving average (the band midpoint) at $0.2483, with the upper band near $0.2700 and the lower band around $0.2276. ADA trading below the midpoint indicates the market is favoring sellers in the immediate term, while the lower band and the weekly low form proximate downside references. A move back toward the daily midpoint would recover some of the recent losses, but the upper band remains roughly 14.5% higher, highlighting the range traders are watching.
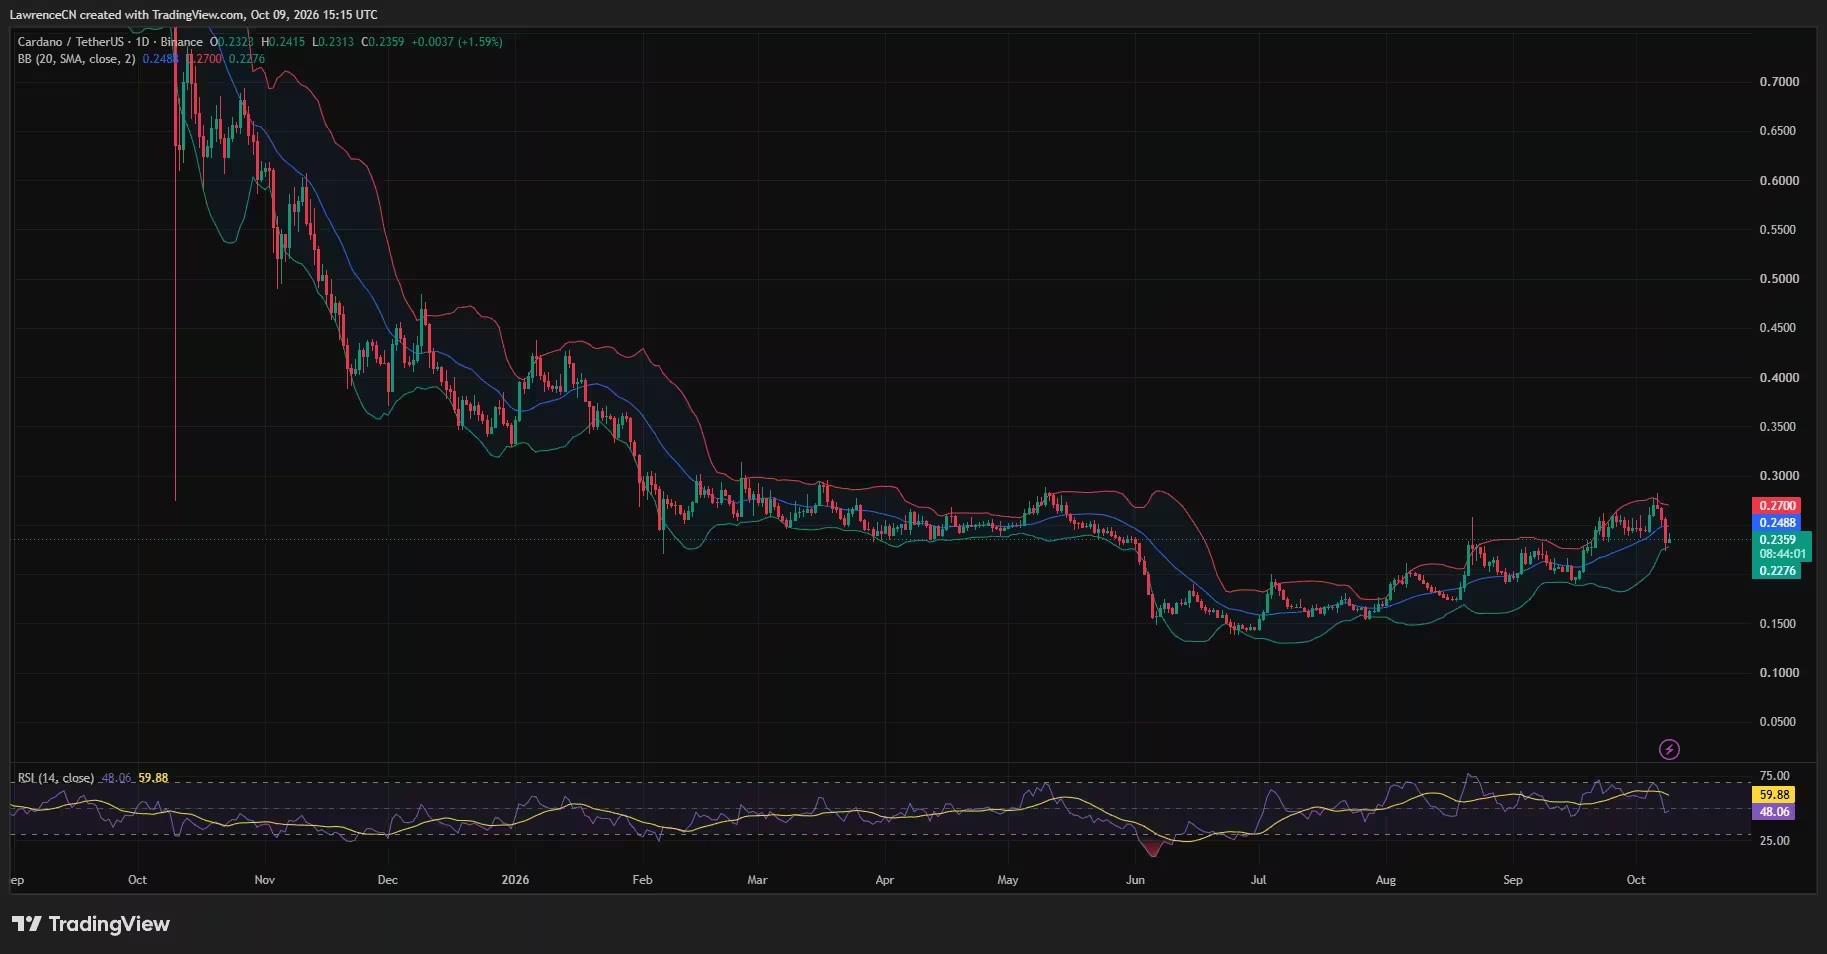
Cardano price daily chart — Oct. 9
Chart patterns and analyst views
Two widely followed analysts shared bearish scenarios that converge on additional downside pressure, albeit via different tools. Technical commentator Ali Martinez pointed to an ascending channel on Cardano's daily chart and identified a rejection at the channel's upper boundary. His channel plot placed the lower boundary close to $0.21 and suggested that a sustained failure around the upper band would make a push to that lower boundary more likely.
Meanwhile, Jesse Olson flagged weakening daily momentum, noting bearish divergence and a sell signal followed by candle closes beneath his trend dots. Olson highlighted a lower yellow zone as a potential retest area, reinforcing the probability of a drawdown toward the same general neighborhood identified by Martinez.
Both approaches highlight a downside setup: Martinez uses channel geometry to locate $0.21 as a conditional target, while Olson relies on momentum and trend-dot triggers that point to a similar band of support. Traders should pay attention to candle closes and the ability of ADA to reclaim $0.24 as a confirmation of short-term recovery.
Intermediary levels to monitor
- $0.256: intermediate resistance marked on Martinez's chart
- $0.29: upper channel zone and a stronger resistance region
- $0.24: immediate psychological and technical pivot
Weekly context: Supertrend and momentum
On the weekly timeframe, the Supertrend indicator remains a resistance line near $0.2762. ADA briefly eclipsed the weekly high of $0.2824 before retreating underneath the Supertrend, leaving a clear resistance zone between $0.2700 and $0.2824 where multiple indicators converge. Recovering to that area would require roughly a 17% climb from current levels and would likely need sustained buying pressure.
The weekly Awesome Oscillator still prints a small positive reading, signaling that longer-term momentum retains some bullish bias despite the short-term pullback. This divergence between daily and weekly indicators emphasizes the need to consider multiple timeframes when planning trades or managing positions.
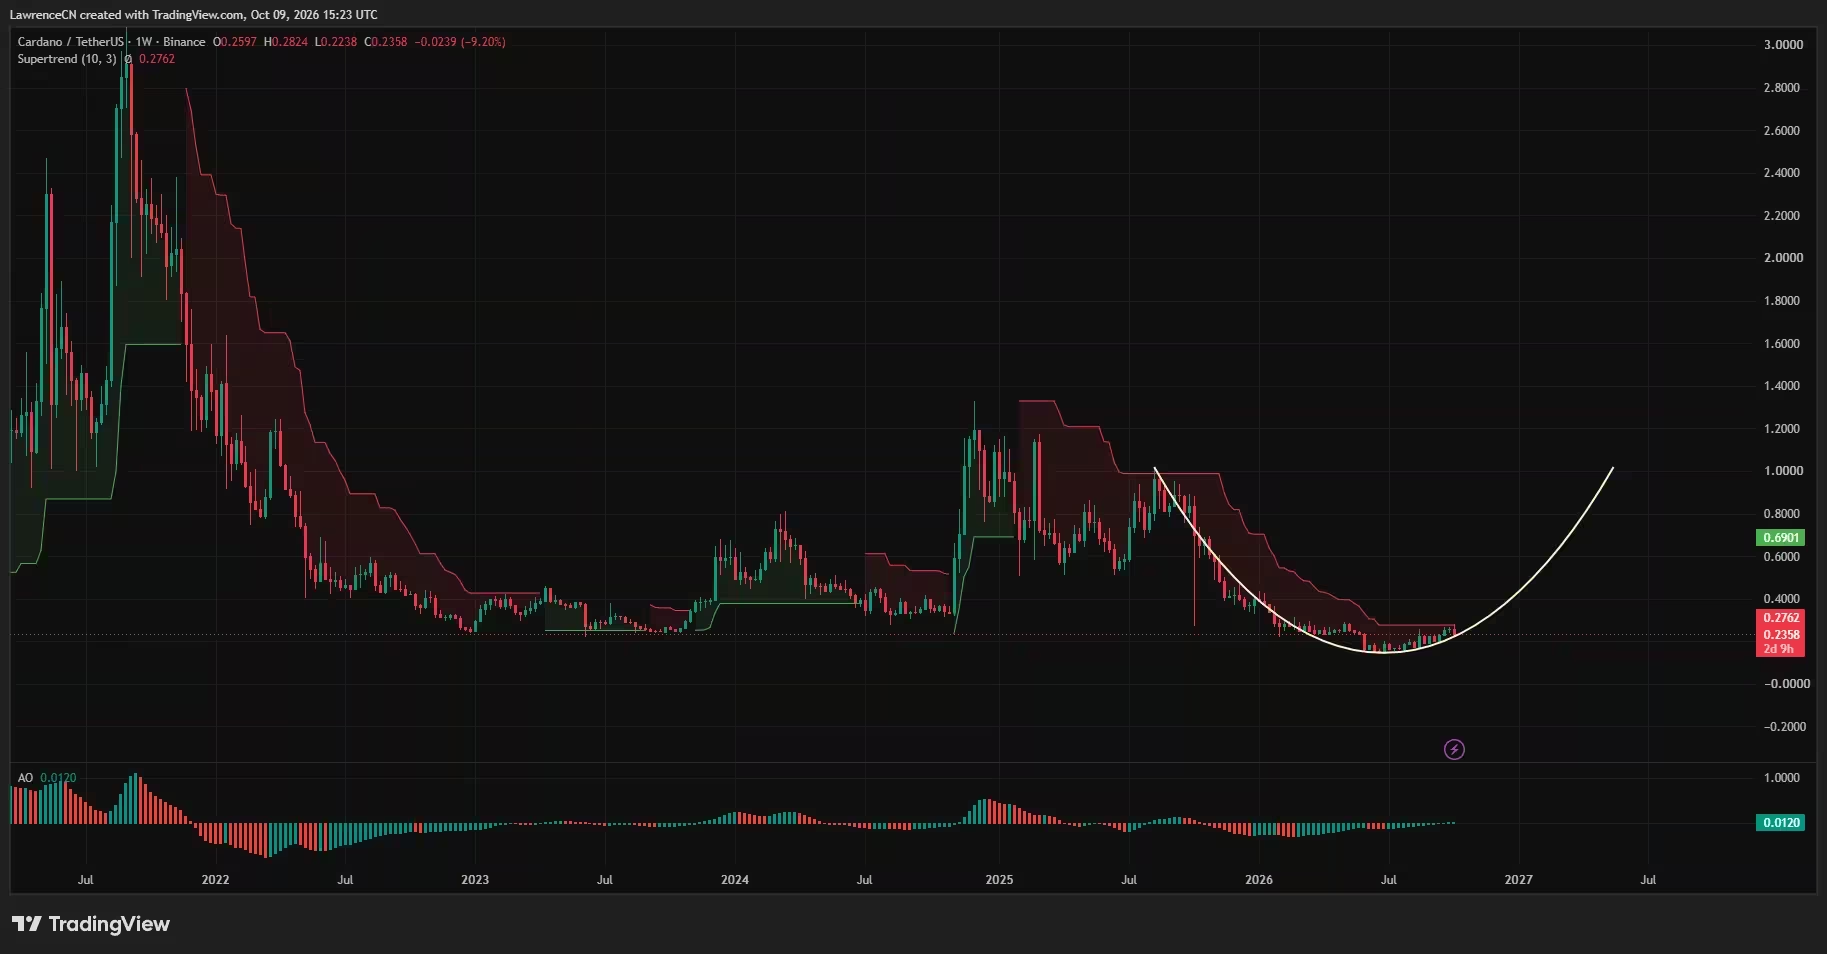
Cardano price weekly chart — Oct. 9
Liquidation risk and market structure
Order-book dynamics and liquidation maps show clustered risk around current pricing. CoinGlass's one-month liquidation heatmap highlights notable concentrations between $0.23 and $0.24, with further bands below near $0.215–$0.22. Brighter liquidation clusters also appear above the price, around $0.257–$0.28, reflecting where leveraged long positions may stack and where short squeezes could trigger volatility.
This arrangement implies that a slip below the $0.2276–$0.2238 region could accelerate downside moves, potentially drawing price toward the $0.21 channel target if stop-heavy areas are hit. Conversely, a sustained reclaim of $0.2483 and then $0.256 could trigger short-covering and test the liquidation concentrations to the upside.
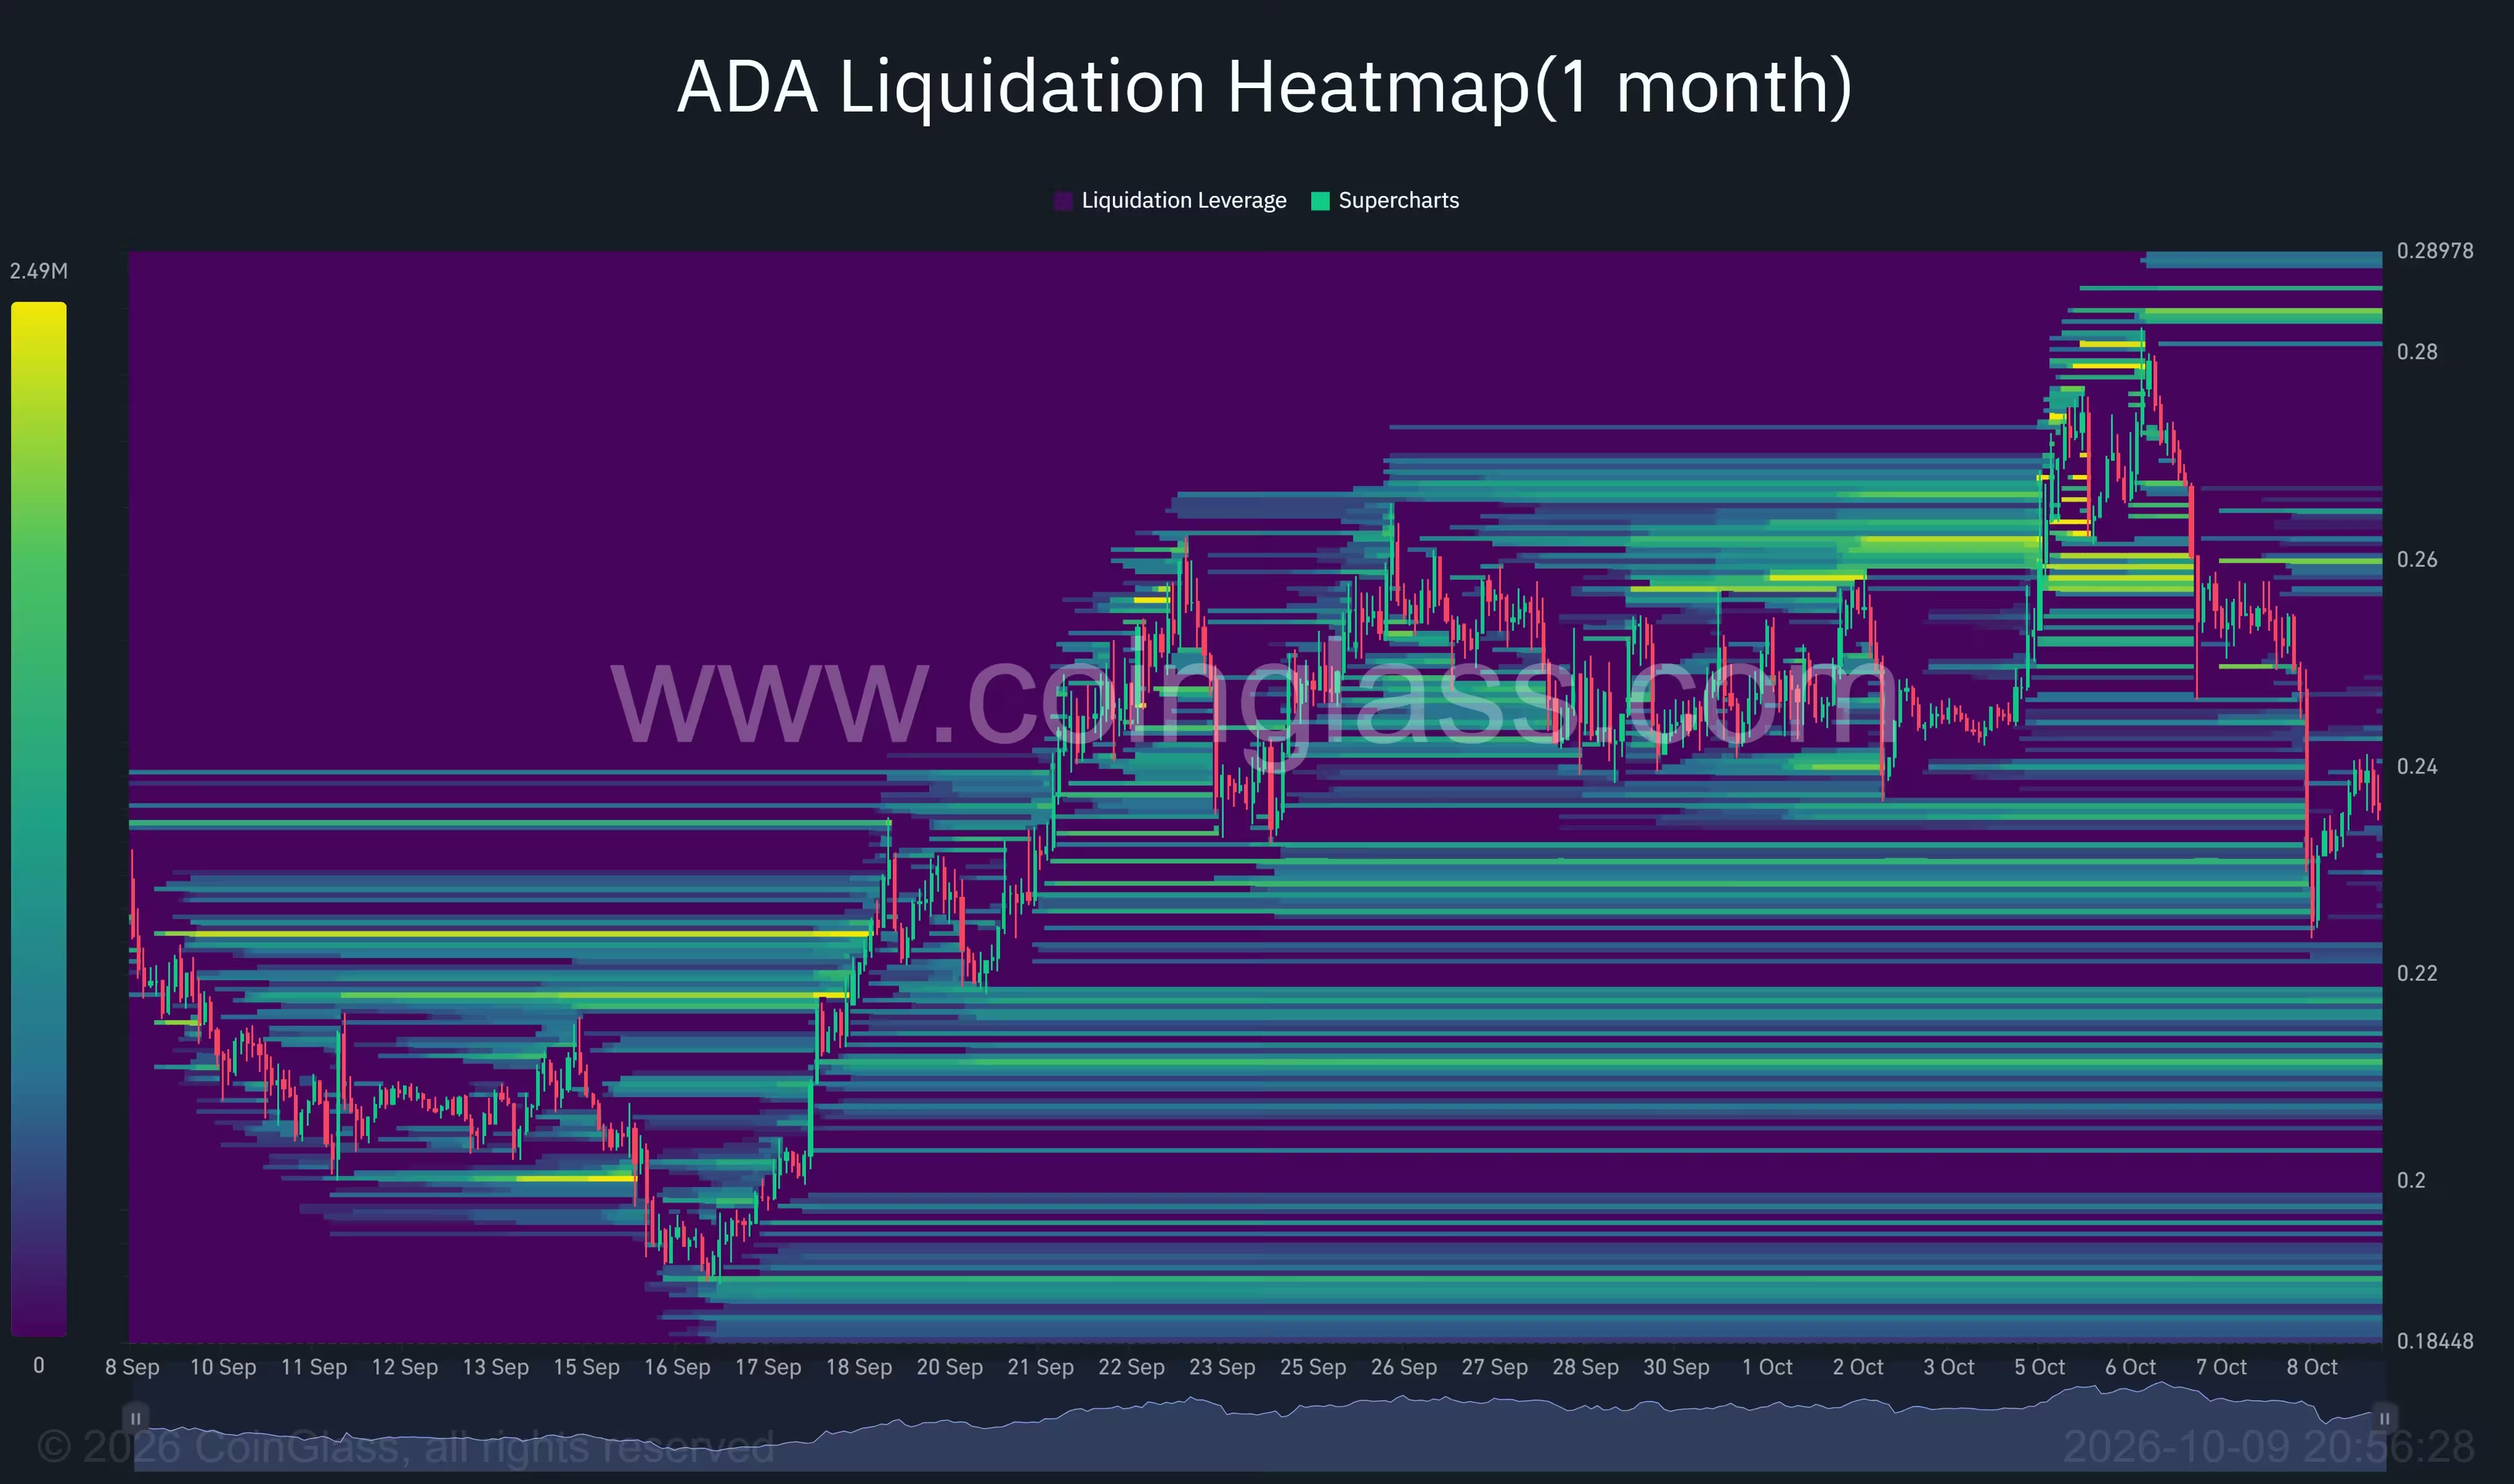
Cardano liquidation heatmap
Investment products and risk considerations
For U.S. investors preferring regulated exposure, the Volatility Shares Cardano ETF provides an instrument-based route to ADA-linked performance rather than direct token holdings. Fund disclosures note price volatility and periodic rebalancing as principal risks. Whether holding spot ADA or ETF exposure, market participants should manage position size, set clear stop levels, and remain aware of the short-term bearish technical cues.
Outlook: What traders should watch
Short-term outlook: The immediate path for ADA centers on how it behaves around $0.24 and the daily midpoint of $0.2483. Failure to regain $0.24 decisively increases the odds of a retest of $0.2276 and $0.2238, with $0.21 remaining a conditional target if selling pressure persists.
Medium-term outlook: Weekly indicators and the positive Awesome Oscillator suggest the longer-term recovery from midyear lows is still intact, but the advance faces resistance from $0.2700–$0.2824. Reclaiming that zone would be an important step to resume a broader uptrend.
Risk management: Traders should track RSI behavior, daily Bollinger band positioning, and liquidation heatmaps. Confirmations with candle closes and volume can help distinguish pullbacks from trend reversals. Given clustered stops and leveraged positions, volatility can spike quickly near the identified support and resistance bands.
In summary, Cardano remains vulnerable beneath $0.24, and technical setups point to a possible descent toward the $0.21 region if current support levels break. At the same time, higher-timeframe momentum leaves room for a recovery if buyers return and clear the $0.2483–$0.256 resistance corridor.


Leave a Comment
Comments
No comments yet. Be the first.