

Ethereum stands near $2,500 after volatile sell-off
Ethereum (ETH) is trading around $2,493 after a steep slide that briefly pushed prices toward $2,400. The move left the token at a technical inflection point: the daily Supertrend has flipped to a bearish reading and short-term momentum indicators continue to show selling pressure. With U.S. spot Ethereum ETFs seeing substantial outflows and several overhead liquidation clusters, market participants are watching whether $2,500 can be reclaimed and sustained.
Key takeaways
- ETH trades near $2,493 after a rebound from roughly $2,400.
- Daily Supertrend resistance sits at $2,764, well above the current price.
- The 4-hour Bollinger midpoint near $2,569 is the next important recovery test.
- U.S. spot Ethereum ETFs recorded $486.1 million in outflows across four sessions.
Daily chart: Supertrend flips, ADX shows waning strength
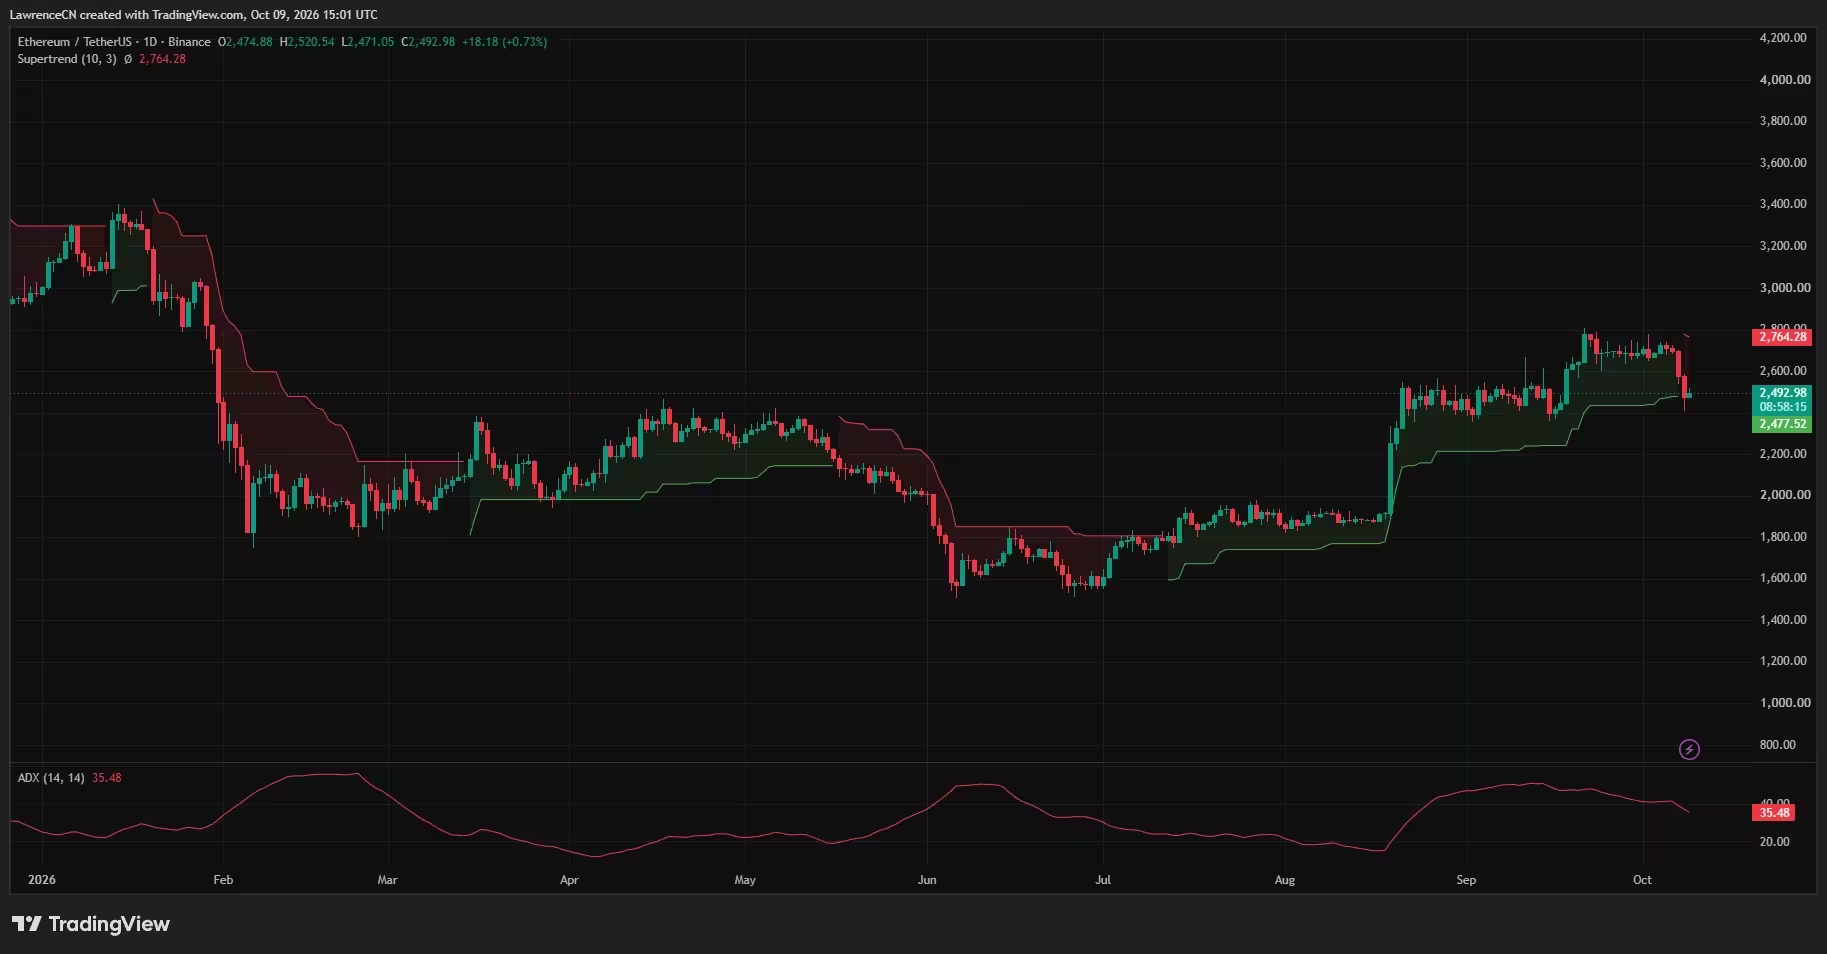
On the TradingView Binance ETH/USDT daily chart, Ethereum regained some ground to $2,492.98 but remains below the $2,500 threshold that traders often treat as a psychological and technical level. The most notable development on the daily timeframe is the Supertrend indicator moving above price and turning red at $2,764.28. That change signals a shift to a bearish trend signal until price clears that resistance.
Ethereum price daily chart — Oct. 9
Previously, the green Supertrend had tracked beneath the market during the August–September rally. The switch to a red Supertrend creates a significant resistance band roughly 10% above current prices; reclaiming that zone would be required to flip the daily trend back to bullish. At the same time, the daily Average Directional Index (ADX) sits around 35.48, which still implies an established trend but has softened from its September highs. ADX measures trend strength rather than direction, so while the Supertrend points bearish, the falling ADX suggests momentum behind the move has moderated.
The earlier $2,650–$2,750 trading range now looms above the market as the key area to recapture for a more meaningful reversal. A return to that zone would retrace a portion of the recent decline but would likely remain vulnerable until the Supertrend near $2,764 is taken out.
Short-term technicals: Bollinger midpoint and money flow matter

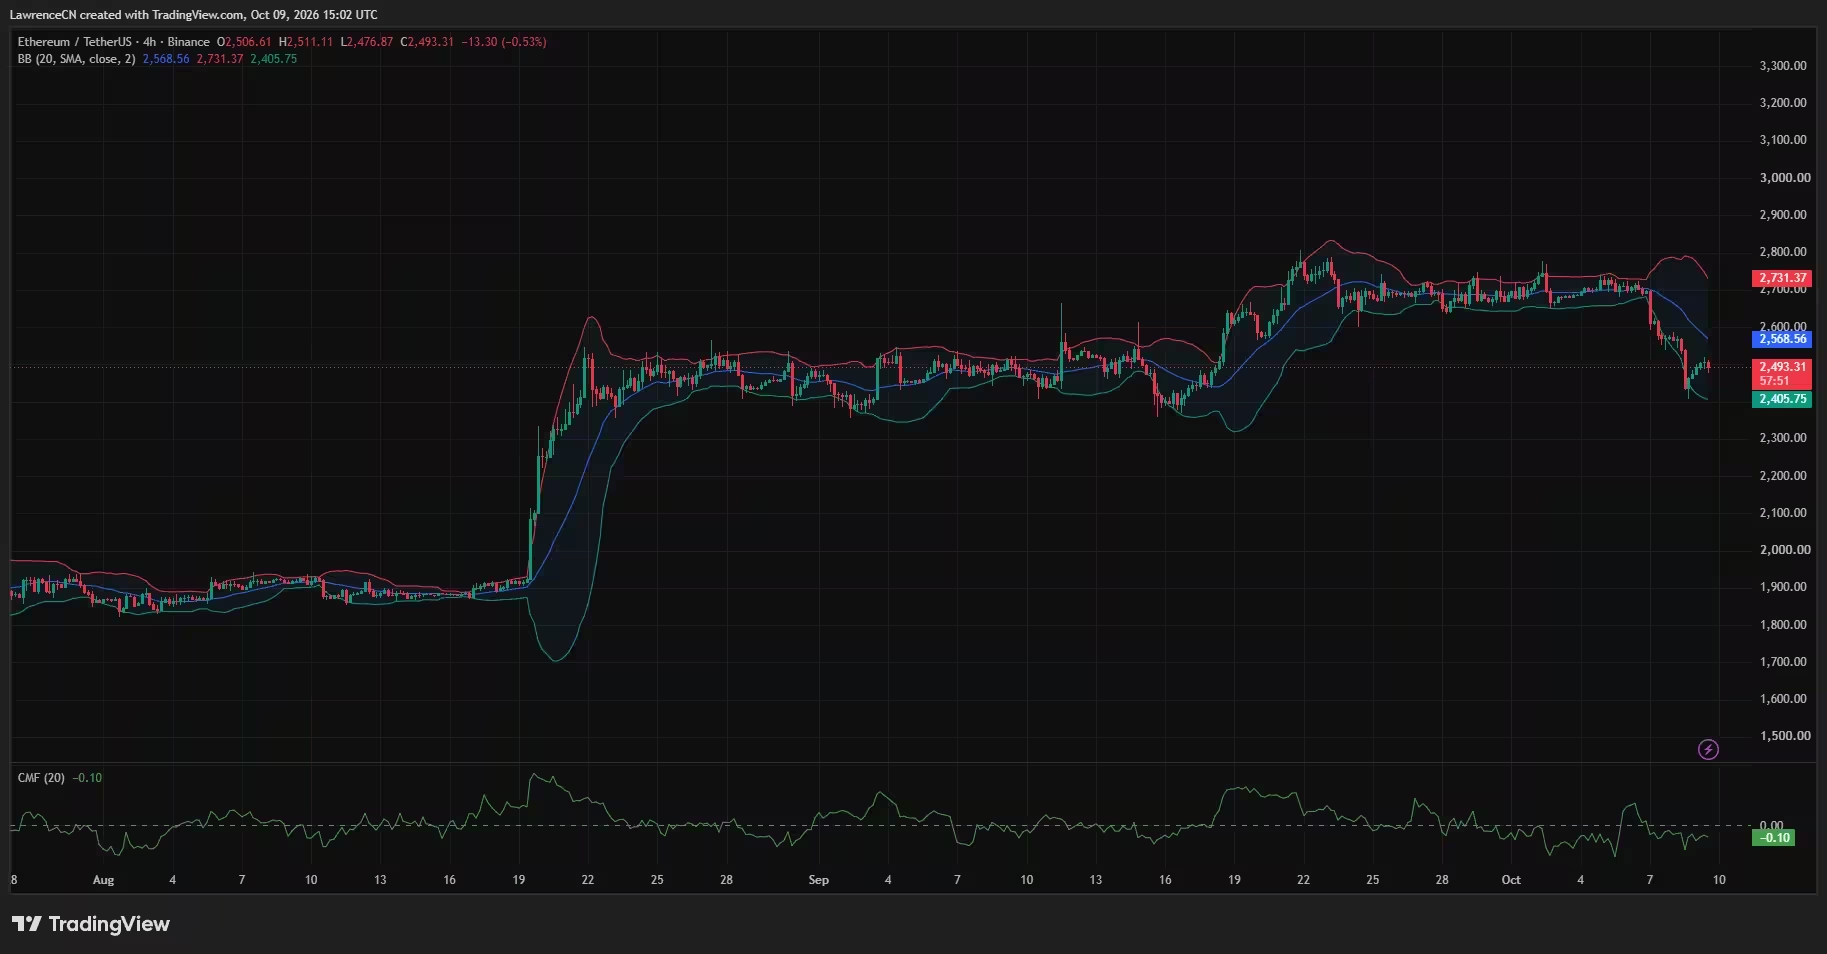
On the 4-hour chart, Ethereum is trading below the 20-period moving average and the Bollinger midpoint, which acts as the round-number technical test ahead of stronger resistance. The Bollinger Bands midpoint is approximately $2,568.56, while the upper and lower bands sit near $2,731.37 and $2,405.75 respectively. That midpoint is roughly 3% above the current price and represents the next technical barrier for bulls.
Ethereum price 4-hour chart — Oct. 9
Further complicating the short-term picture is the Chaikin Money Flow (CMF), which reads -0.10 on the 4-hour timeframe. A negative CMF signals distribution during the measured period, meaning capital flows have favored sellers even as price attempted to recover. Until ETH moves back above the Bollinger midpoint and CMF crosses into positive territory, the short-term recovery lacks confirmation.
If sellers regain control, the lower Bollinger band around $2,406 overlaps closely with the recent low near $2,400. A decisive break below that band would expose ETH to further downside and could trigger additional liquidations.
On-chain and ETF flows: outflows add downside pressure
Spot ETF activity in the U.S. has been a notable driver of liquidity dynamics this week. Farside Investors recorded $201.9 million in outflows on Oct. 6 and another $160.9 million on Oct. 7, with additional withdrawals of $72.5 million on Oct. 8 and $50.8 million on Oct. 5. Total net redemptions reached $486.1 million across four sessions, extending an eight-session outflow streak. Persistent ETF outflows can exacerbate price declines by removing buy-side demand during volatile periods.
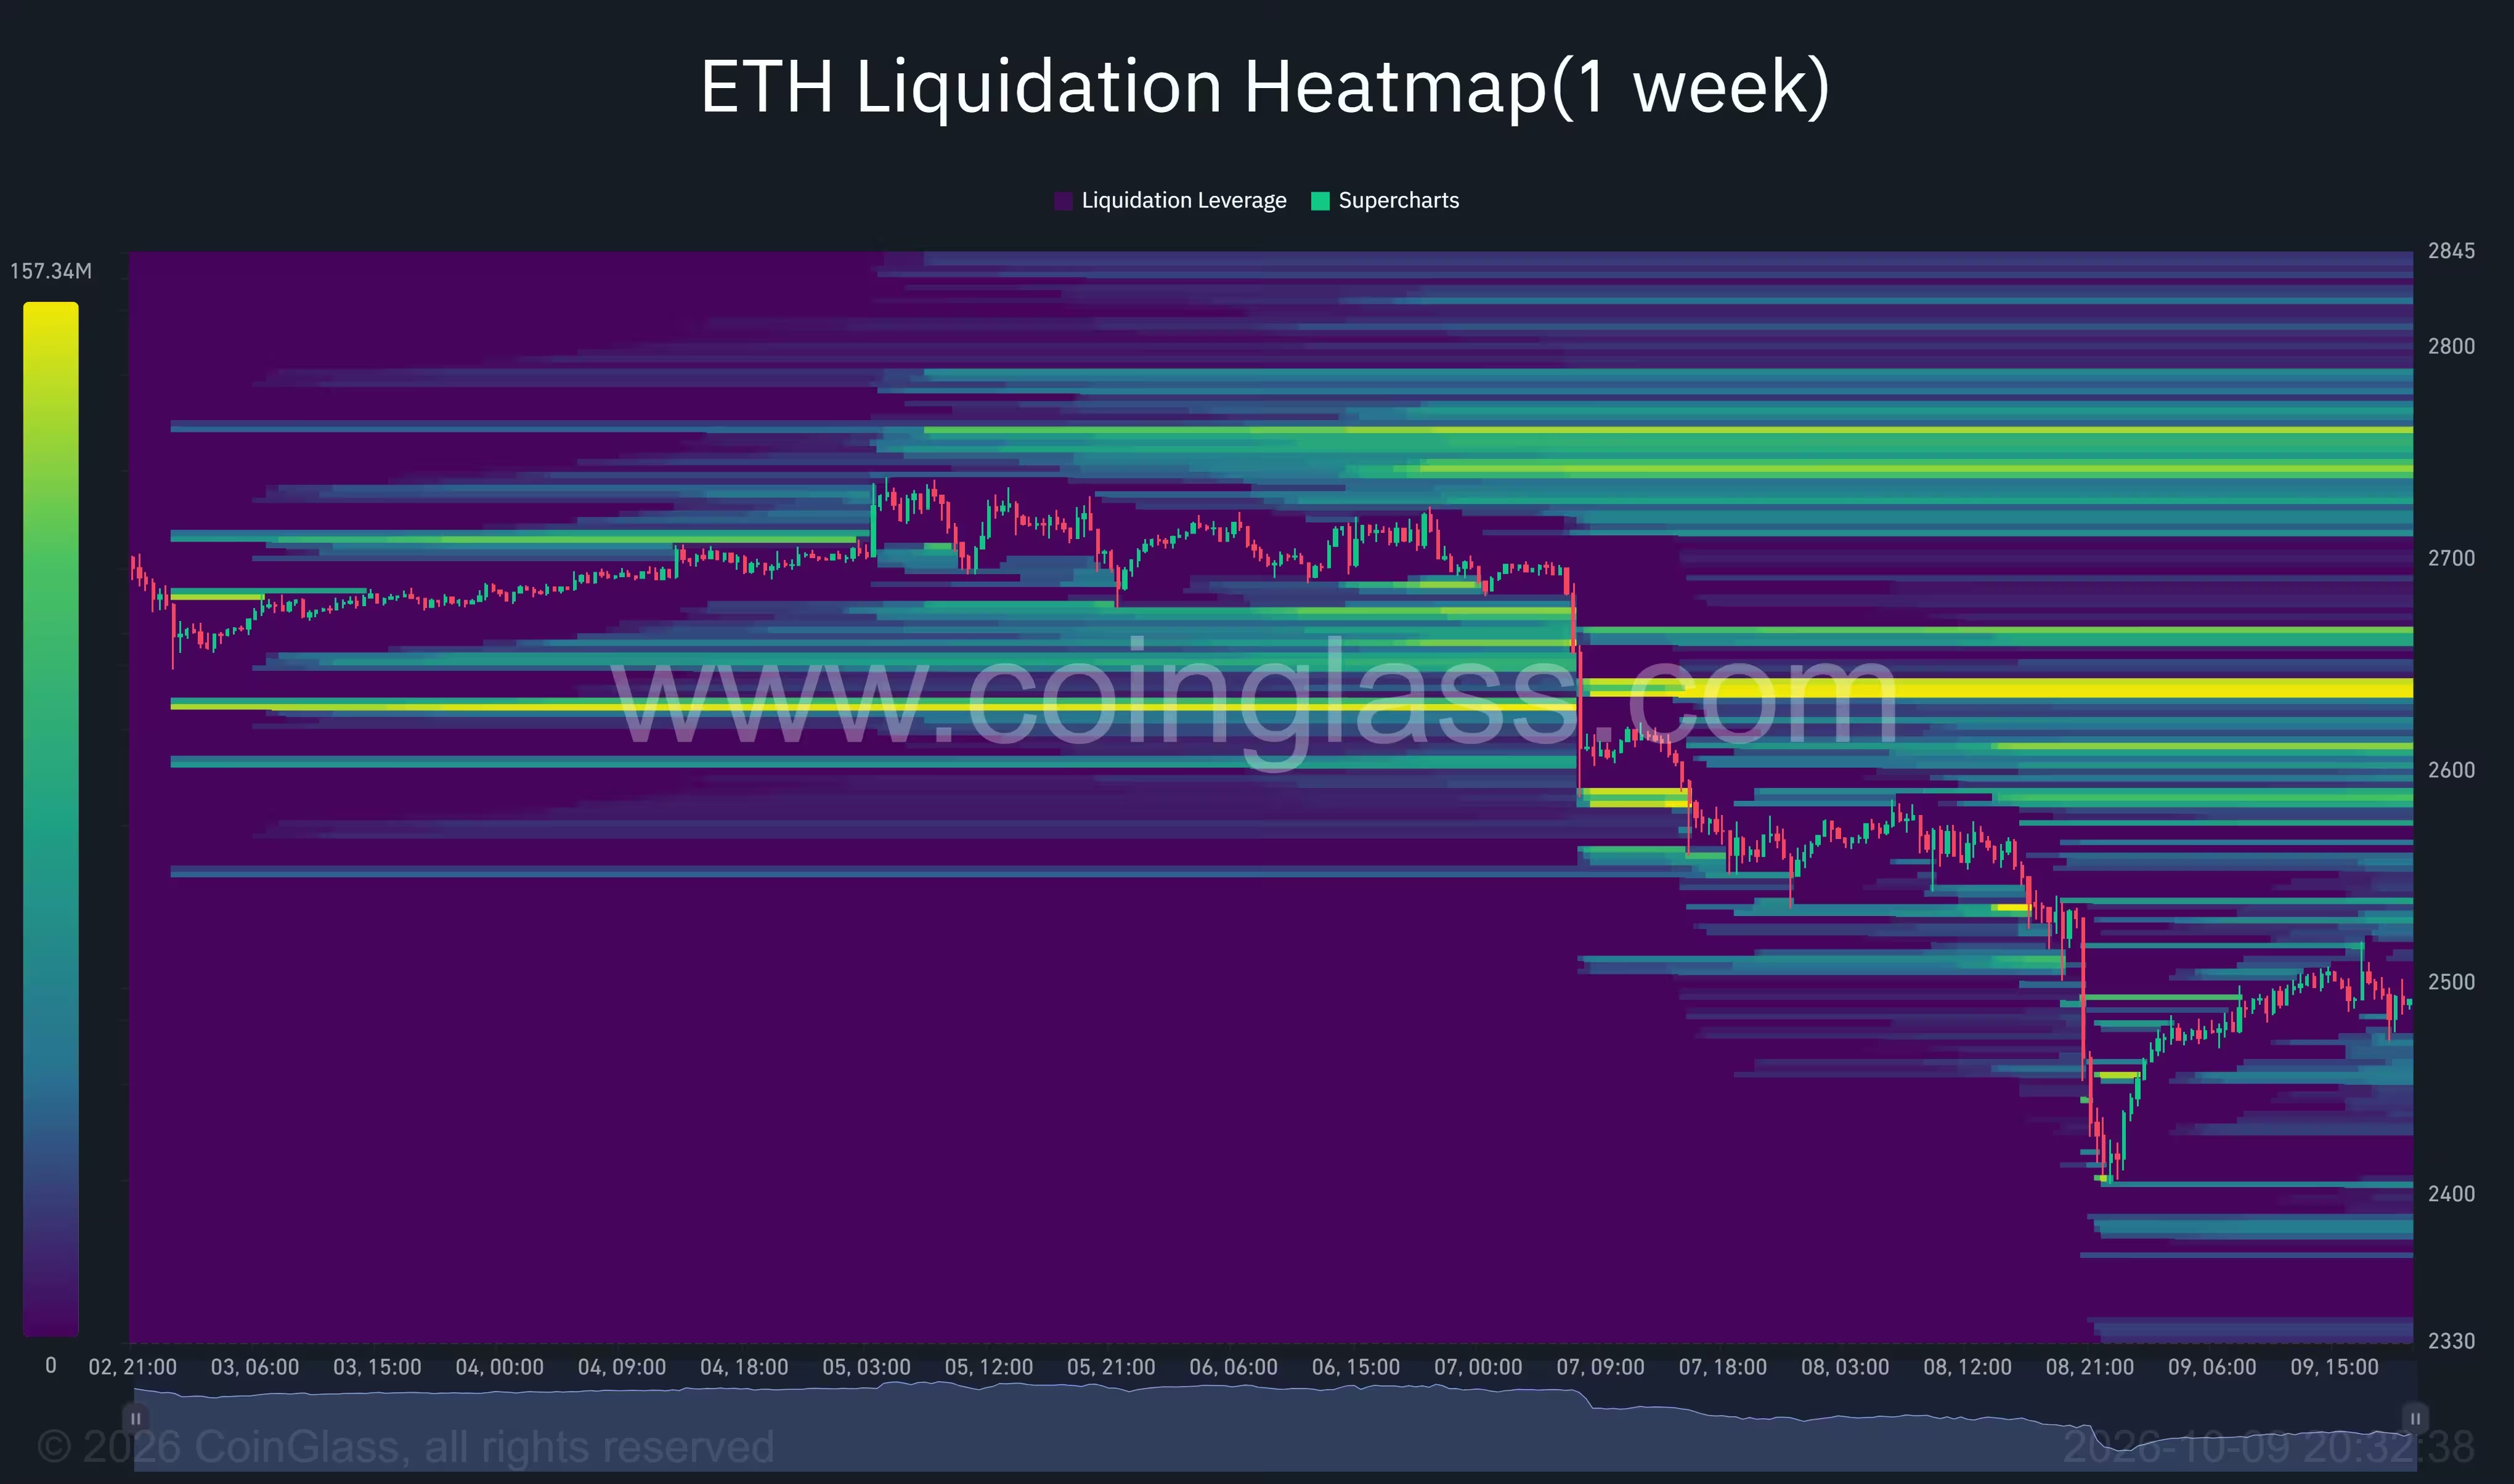
CoinGlass liquidation mapping shows concentration of potential overhead squeeze points in the mid-$2,600s and near $2,740–$2,760, zones where stop-loss orders and margin liquidations could cluster if price attempts a recovery. Closer to current levels, smaller liquidation bands sit around $2,450–$2,460 and $2,400.

Ethereum liquidation heatmap
These heatmap clusters matter for traders because they indicate where forced buying or selling could intensify moves. Overhead concentration near $2,635–$2,640 may create resistance as market participants who were long at those levels look to exit or get stopped out.
Macro and sentiment context
Beyond technicals, macro factors and sentiment play a role. Headlines about regulatory developments, ETH staking flows, and broader equity risk appetite influence institutional investment in spot ETFs and OTC desks. The recent ETF outflows suggest some institutions are either trimming exposure or reallocating capital, which magnifies the technical resistance already present.
Chart patterns and alternative scenarios
Not all analysts are bearish. A weekly viewpoint shared by a popular charting analyst highlighted a potential inverse head-and-shoulders forming on the weekly timeframe, with a reclaimed neckline and a strengthening Relative Strength Index (RSI). If that structure holds on a successful retest, a bullish extension toward $3,200–$4,000 could become plausible. However, that scenario is conditional on the weekly retest holding and longer-term support staying intact.
On shorter timeframes, the immediate hurdles to any bullish scenario remain $2,500 and then the Bollinger midpoint near $2,569. Sustained reclaiming of these levels, accompanied by positive CMF readings and improved volume, would be necessary to build confidence for a rally back toward the prior trading range and the daily Supertrend line.
Risk management for traders
- Watch the $2,500 round number closely; it is both a psychological and technical pivot.
- Use the 4-hour Bollinger midpoint (~$2,569) and the daily Supertrend (~$2,764) as reference points for scaling risk.
- Monitor CMF and ADX for confirmation of directional strength.
- Consider ETF flow data and liquidation heatmaps when sizing positions to account for potential forced moves.
Conclusion: conditional recovery or deeper pullback?
Ethereum sits at a crossroads. The daily Supertrend has turned bearish and short-term indicators show selling pressure, while ETF outflows and liquidation clusters add a layer of vulnerability. For bulls, reclaiming and holding $2,500 is the immediate priority, followed by a move above the 4-hour Bollinger midpoint near $2,569 to validate a stronger recovery. For bears, a breakdown beneath the recent trough and the lower Bollinger band around $2,406 would increase the likelihood of further downside.

Traders and investors should blend technical analysis with on-chain flows and ETF data to assess conviction. The path ETH takes over the coming sessions will likely be guided as much by liquidity and institutional flows as by pure price action.

Leave a Comment
Comments
No comments yet. Be the first.