

Ethereum fell beneath the $2,000 mark as widespread selling in crypto markets and renewed pressure on tech stocks compounded investor concern. ETH liquidations neared $250 million while US spot Ethereum ETFs recorded sizable outflows. Developers also postponed planned Glamsterdam testing on the Hoodi testnet while auditors review potential smart contract compatibility issues.
Market snapshot: ETH tumbles amid broad selloff
According to crypto.news market data, Ethereum (ETH) traded near $1,935 on Friday, November 13, as Bitcoin slipped below $70,000 and the wider crypto market lost roughly 5.4% in a single session. Ether’s drop — about 6% in 24 hours — reflected cross-market risk aversion after the unexpected resignation of Nvidia CEO Jensen Huang, which sent technology and AI-linked equities tumbling and helped trigger fresh crypto selling.
Key short-term drivers
- Macro and rate expectations: Inflation and Fed-rate anticipation continued to weigh on risk assets, including major cryptocurrencies.
- Tech-sector shock: Nvidia’s leadership change unsettled AI and semiconductor stocks, prompting a broader re-pricing of technology exposure.
- ETF flows and liquidity: Large outflows from US spot Ethereum ETFs reduced institutional demand and amplified selling pressure.

Liquidations and ETF redemptions
Derivatives data from CoinGlass indicated roughly $249.8 million in Ethereum positions were liquidated across 24 hours. Long trades accounted for approximately $225.9 million — more than 90% of the total — while short liquidations were around $23.9 million. Forced liquidations occur when leveraged positions are closed automatically by exchanges as margin erodes, and in volatile selloffs they can accelerate price declines.
At the same time, Farside Investors reported US spot Ethereum ETFs saw $144.8 million in net withdrawals on November 11. BlackRock’s ETHA fund represented the bulk of those outflows at about $129.8 million, with other smaller funds contributing additional redemptions. From the start of November through November 11, spot Ethereum ETFs had lost roughly $695.9 million, underscoring a period of muted institutional inflows.
Glamsterdam test delayed as developers review EIPs
Ethereum core developers postponed the Glamsterdam activation on the Hoodi testnet to address potential compatibility problems identified during audits. Proposed protocol changes under EIP-8037 and EIP-8038 could alter gas costs for some operations that access or create blockchain state, potentially changing how existing smart contracts behave.
Auditors flagged contracts that might respond differently after the upgrade, so the Ethereum Foundation delayed the Hoodi testnet activation while teams examine the findings. Further developer discussions were scheduled for November 19 to review audit results and determine any adjustments. No new mainnet activation date has been announced.

Technical outlook: support levels and indicators
On the daily chart ETH traded near $1,925 after a low at $1,917, continuing a pattern of lower highs and lower lows with sellers in control below $2,000. Analysts have pointed to Fibonacci support near $1,920 and $1,832 as key levels to watch. Crypto analyst More Crypto Online noted ETH hit the $1,920 Fibonacci area but has not yet formed a confirmed bottom, adding that there are no clear signals for a reversal yet.
Another market observer, CrediBULL Crypto, said the recent pullback weakened prior bullish wave counts and now expects further downside toward the lower end of Ethereum’s trading range before any sustainable recovery. His longer-term invalidation level sits at $1,380, though he did not project an immediate move that low.
Technical momentum remained weak: the daily Relative Strength Index (RSI) was near 24.09 — well below the oversold threshold of 30 — and the MACD stayed negative. Immediate support areas to monitor include $1,900, $1,850 and $1,750. On the upside, daily resistance and key psychological levels lie at $2,000, $2,020 and $2,100, but ETH would need persistent buying pressure to clear those levels and reverse the downward trend.
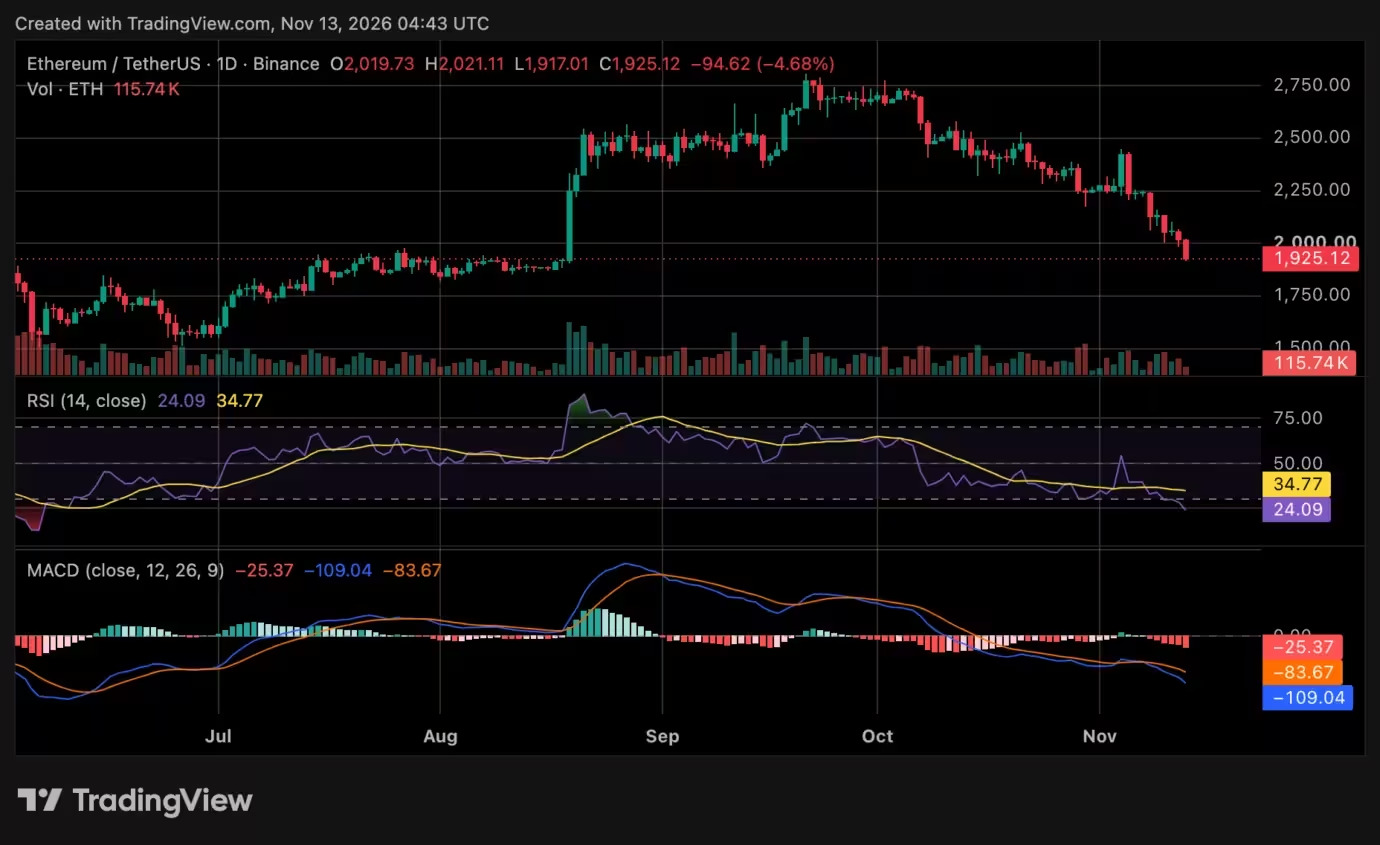
Ethereum price chart
What this means for traders and investors
Short-term traders should remain mindful of heightened volatility: leverage amplifies both gains and losses and recent liquidations highlight the risks of extended long exposure in a falling market. For longer-term investors, the fundamentals of Ethereum’s blockchain — including smart contract utility, decentralized finance (DeFi) activity and upcoming protocol upgrades — remain critical to monitor, but short-term price action will likely be influenced by macro sentiment, ETF flows and technical momentum.
Risk management takeaways
- Consider reducing leverage and setting conservative stop-losses to manage downside risk.
- Watch ETF flow data and derivatives liquidations for near-term liquidity signals.
- Track audit outcomes and developer updates on EIP-8037/EIP-8038 and Glamsterdam testing for potential protocol-level impacts on smart contracts and gas dynamics.
Outlook

Ethereum’s breach of $2,000 marks a significant near-term setback, but whether this becomes a deeper crash will depend on macro developments, institutional demand via spot ETFs, and how quickly technical momentum can stabilize. Traders should watch the $1,920 to $1,832 zone for potential support, while a decisive recovery above $2,100 would be needed to shift momentum back toward the bulls. Until then, the market remains vulnerable to further downside risk amid continuing ETF outflows and weak global risk sentiment.

Leave a Comment
Comments (1)
This sounds off, are liquidations really ~250M and ETFs pulling 145M? Nvidia drama fits, but the data feels rushed, anyone got sources? kinda sus..