

Bitcoin slips under the $68K trendline as sellers press lower
Bitcoin (BTC) dropped sharply in mid-November, trading near $67,200 on Nov. 14 after a sustained sell-off that pushed price beneath the key 200-week moving average. The decline erased more than 10% of value during the week, and intraday lows tested levels around $66,456 on Binance before a modest rebound toward $67,194. The daily candle was down roughly 1.64%, while the weekly chart reflected a deeper retracement of about 10.24% from a weekly open near $74,851.
Market snapshot and immediate technical context
On the weekly timeframe, Bitcoin’s 200-week simple moving average sat at $67,992. The price was trading approximately 1.2% below that level in the intraweek snapshot, leaving confirmation of a persistent break dependent on the weekly close. Longer-term moving averages lie notably higher: the 20-week at $74,007, the 50-week at $75,072 and the 100-week at $88,730, all providing overhead resistance if buyers attempt a recovery.
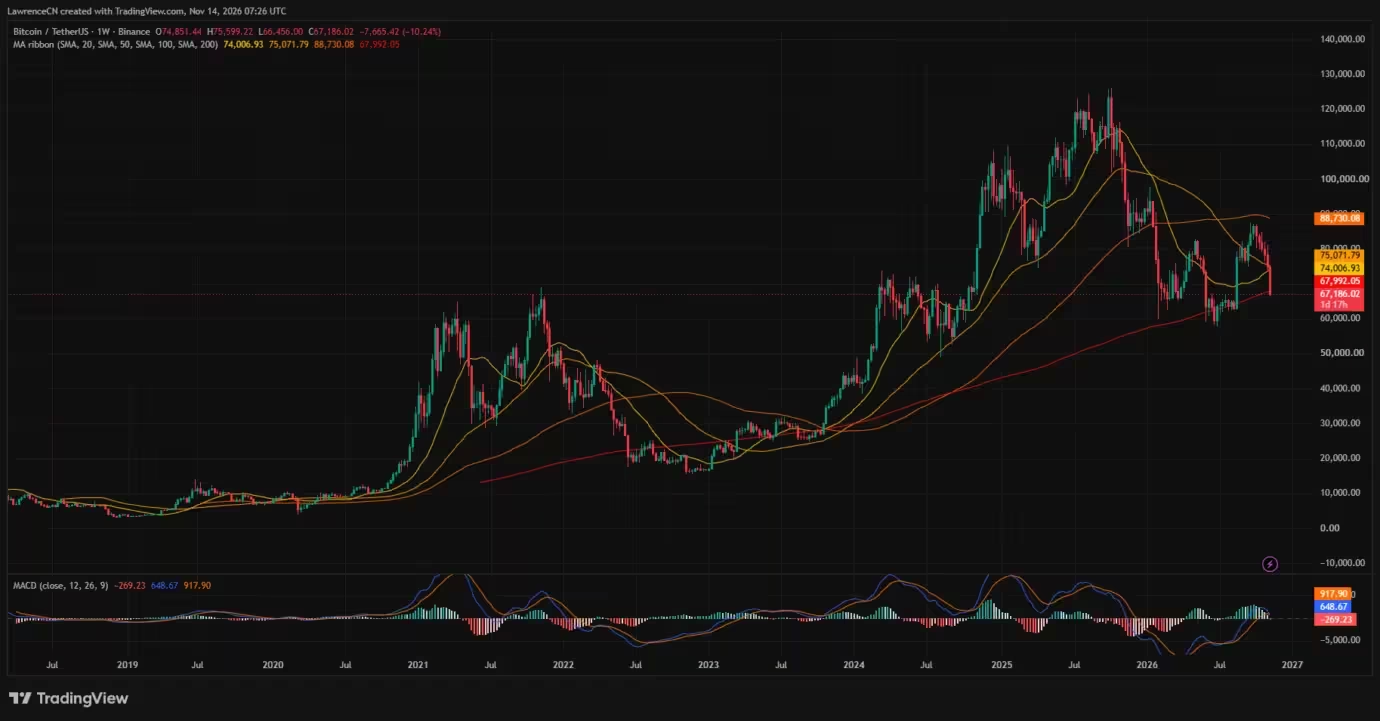
Bitcoin price weekly chart — Nov. 14
Weekly momentum
Momentum indicators signaled weakening strength. The weekly MACD line registered around 648.67, below the signal line at 917.90 and producing a negative histogram near 269.23 points. Although both MACD lines remained above zero, the recent crossover highlighted fading bullish momentum and increased vulnerability to further downside.
Daily indicators: oversold but not yet reversed
The daily relative strength index (RSI) plunged to 22.96, well into oversold territory under the conventional 30 threshold, while its short-term average remained elevated at 35.48. Price action pushed below the lower Bollinger Band at $68,654, with the Bollinger midpoint (20-day SMA) around $76,064 and the upper band near $83,474. The bands widened as large red candles accelerated selling pressure.
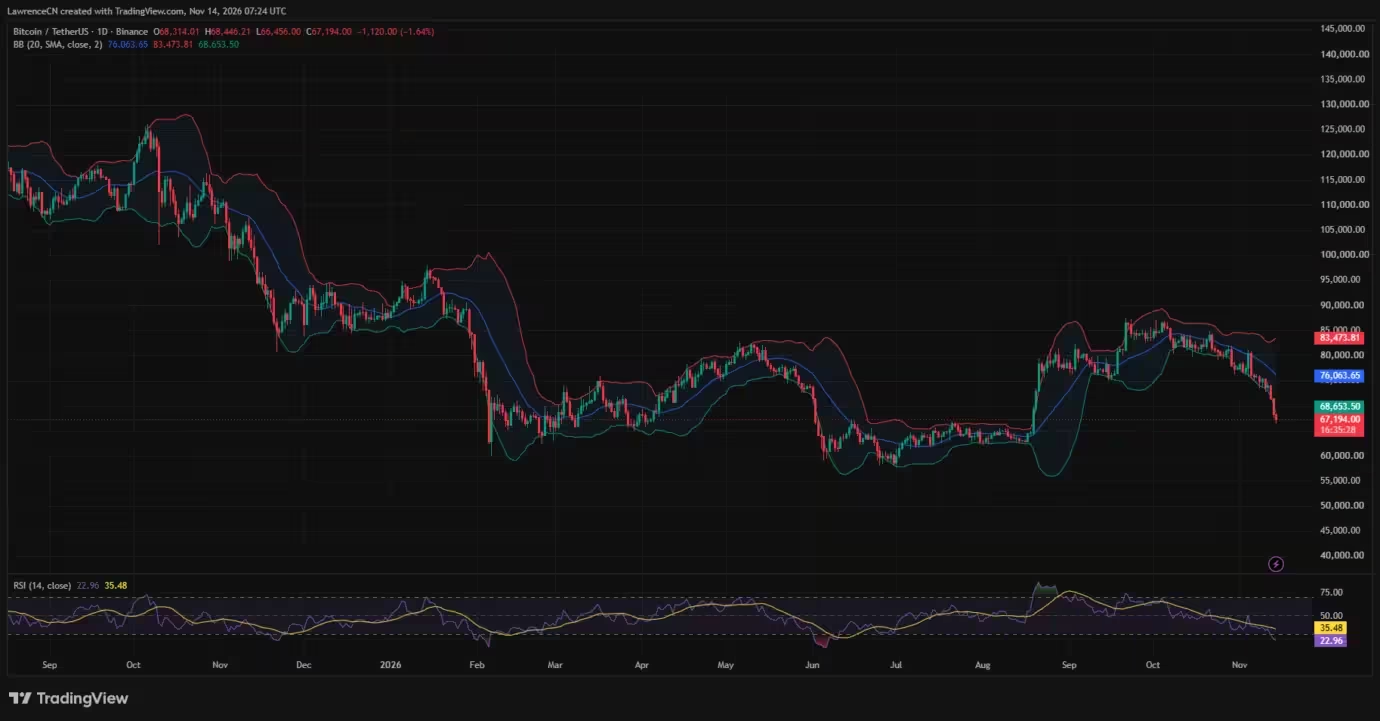
Bitcoin price daily chart — Nov. 14
What the oversold readings mean
An RSI below 30 commonly precedes short-term bounces, but it is not a guarantee of a sustained reversal. At the time of the snapshot, BTC had yet to reclaim the lower Bollinger Band or reassert footing above $70,000. Near-term recovery references cluster between the lower band and the 200-week average in the $68,000–$68,650 range, while the weekly moving average band near $74,000–$75,100 aligns with the daily Bollinger midpoint — a confluence of resistance that could cap rallies.

Institutional flows and ETF withdrawals
Part of the sell-off coincided with continued institutional outflows from U.S. spot Bitcoin ETFs. Data through Nov. 11 showed roughly $1.44 billion withdrawn across five trading sessions, per SoSoValue. On a single day, BlackRock’s IBIT accounted for $269.73 million of a $299.9 million net outflow. Despite these short-term redemptions, cumulative net inflows into U.S. spot BTC ETFs since their January 2024 launches remained positive, totaling about $55.1 billion.
Liquidity and stablecoin supply
Liquidity metrics also weakened ahead of the drop. Analysts highlighted the need for sustained positive ETF flows and stronger spot demand to underpin a durable recovery. Stablecoin market capitalization fell to roughly $289.81 billion, down about 4.57% over 30 days, adding another headwind for spot buying pressure.
Derivatives liquidations and heatmap structure
Leverage traders suffered heavy losses during the move lower. CoinGlass reported nearly $1.47 billion in leveraged crypto liquidations over a 24-hour window, with approximately $1.31 billion of that tied to long positions — nearly 89% of the total liquidations. Charts tracking liquidation exposure show concentrated clusters at multiple overhead zones: $72,000–$73,000, $75,000–$78,000 and larger bands around $82,000–$83,000. These clusters represent estimated liquidation vulnerability and should not be conflated with guaranteed buy orders or price targets.
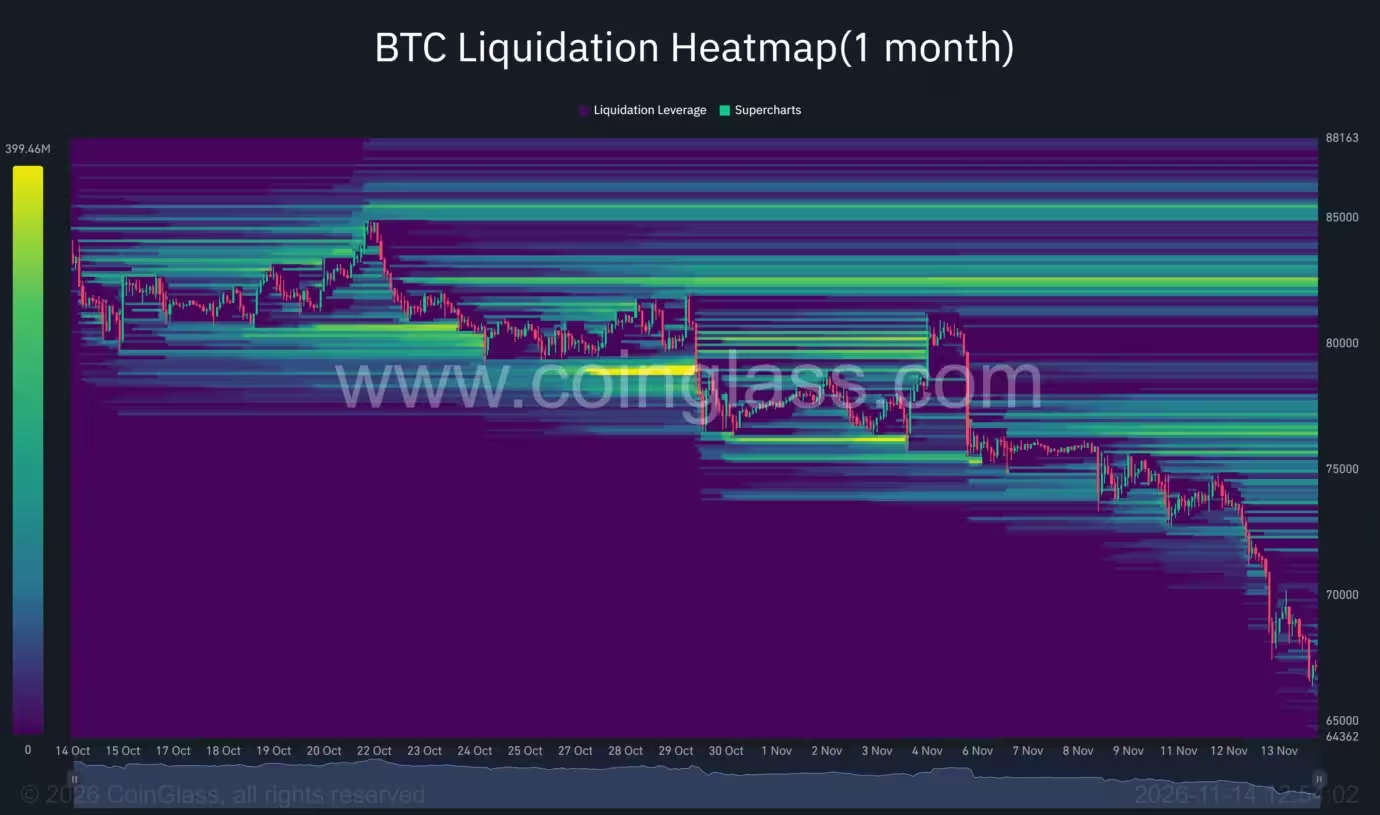
Bitcoin liquidation heatmap
Trader reactions and possible support at $66K
Prominent market participants signaled they were ready to buy into the weakness. X (formerly Twitter) user Merlijn The Trader highlighted the loss of the $73,000–$70,000 area and reiterated the importance of the weekly close. He stated publicly he planned to place bids at $66,000 after BTC fell below $70,000. That level, combined with prior trading zones around $60,000–$63,000, provides potential support reference points if downside momentum continues.
Short-term scenarios
Bear-case: If sellers maintain control and the weekly candle closes decisively beneath the 200-week moving average, BTC could test lower demand clusters and prior range lows near $60,000–$63,000. A sustained absence of ETF inflows and persistent stablecoin drawdown would reinforce this scenario. Bull-case: A bounce back above $70,000, ideally supported by renewed ETF inflows and lower liquidation pressure, would open the path to retest the weekly moving averages in the $74,000–$75,100 corridor. A decisive reclaim of those levels would re-accelerate momentum toward prior highs.
What traders and investors should watch next
Key levels: monitor the weekly close relative to the 200-week SMA (~$67,992), the lower Bollinger Band (~$68,654) and near-term support at $66,000. On-chain and ETF flow data will remain critical: persistent outflows could amplify downside, while an immediate return of spot demand could stabilize price. Macro inputs such as U.S. inflation releases and risk sentiment in broader markets could trigger intraday volatility. Derivatives metrics — open interest, funding rates and liquidation heatmaps — will signal whether leveraged positions are being rapidly unwound or if liquidity is returning to the order book.

For traders and investors, the current environment requires disciplined risk management. Oversold daily indicators may offer short-term buying opportunities, but the weekly chart and institutional flow dynamics will determine whether this is a retracement or the start of a deeper corrective phase for Bitcoin.

Leave a Comment
Comments (2)
Whoa that drop was brutal! bought a little at 66k, fingers crossed lol but kinda nervous if this keeps bleeding...
Wait, is this real? 200-week SMA broken and ETFs pulling out... Could 66k hold or is more pain coming?