
3 Minutes
Death cross appears as BTC slips below major moving averages
Bitcoin has developed a technical death cross after its short-term trend line dipped beneath the longer-term average, a signal traders watch for potential trend shifts. The setup followed BTC falling below both the 50-day and 200-day moving averages, with price trading near the low 90k range and roughly 5% lower on the day.
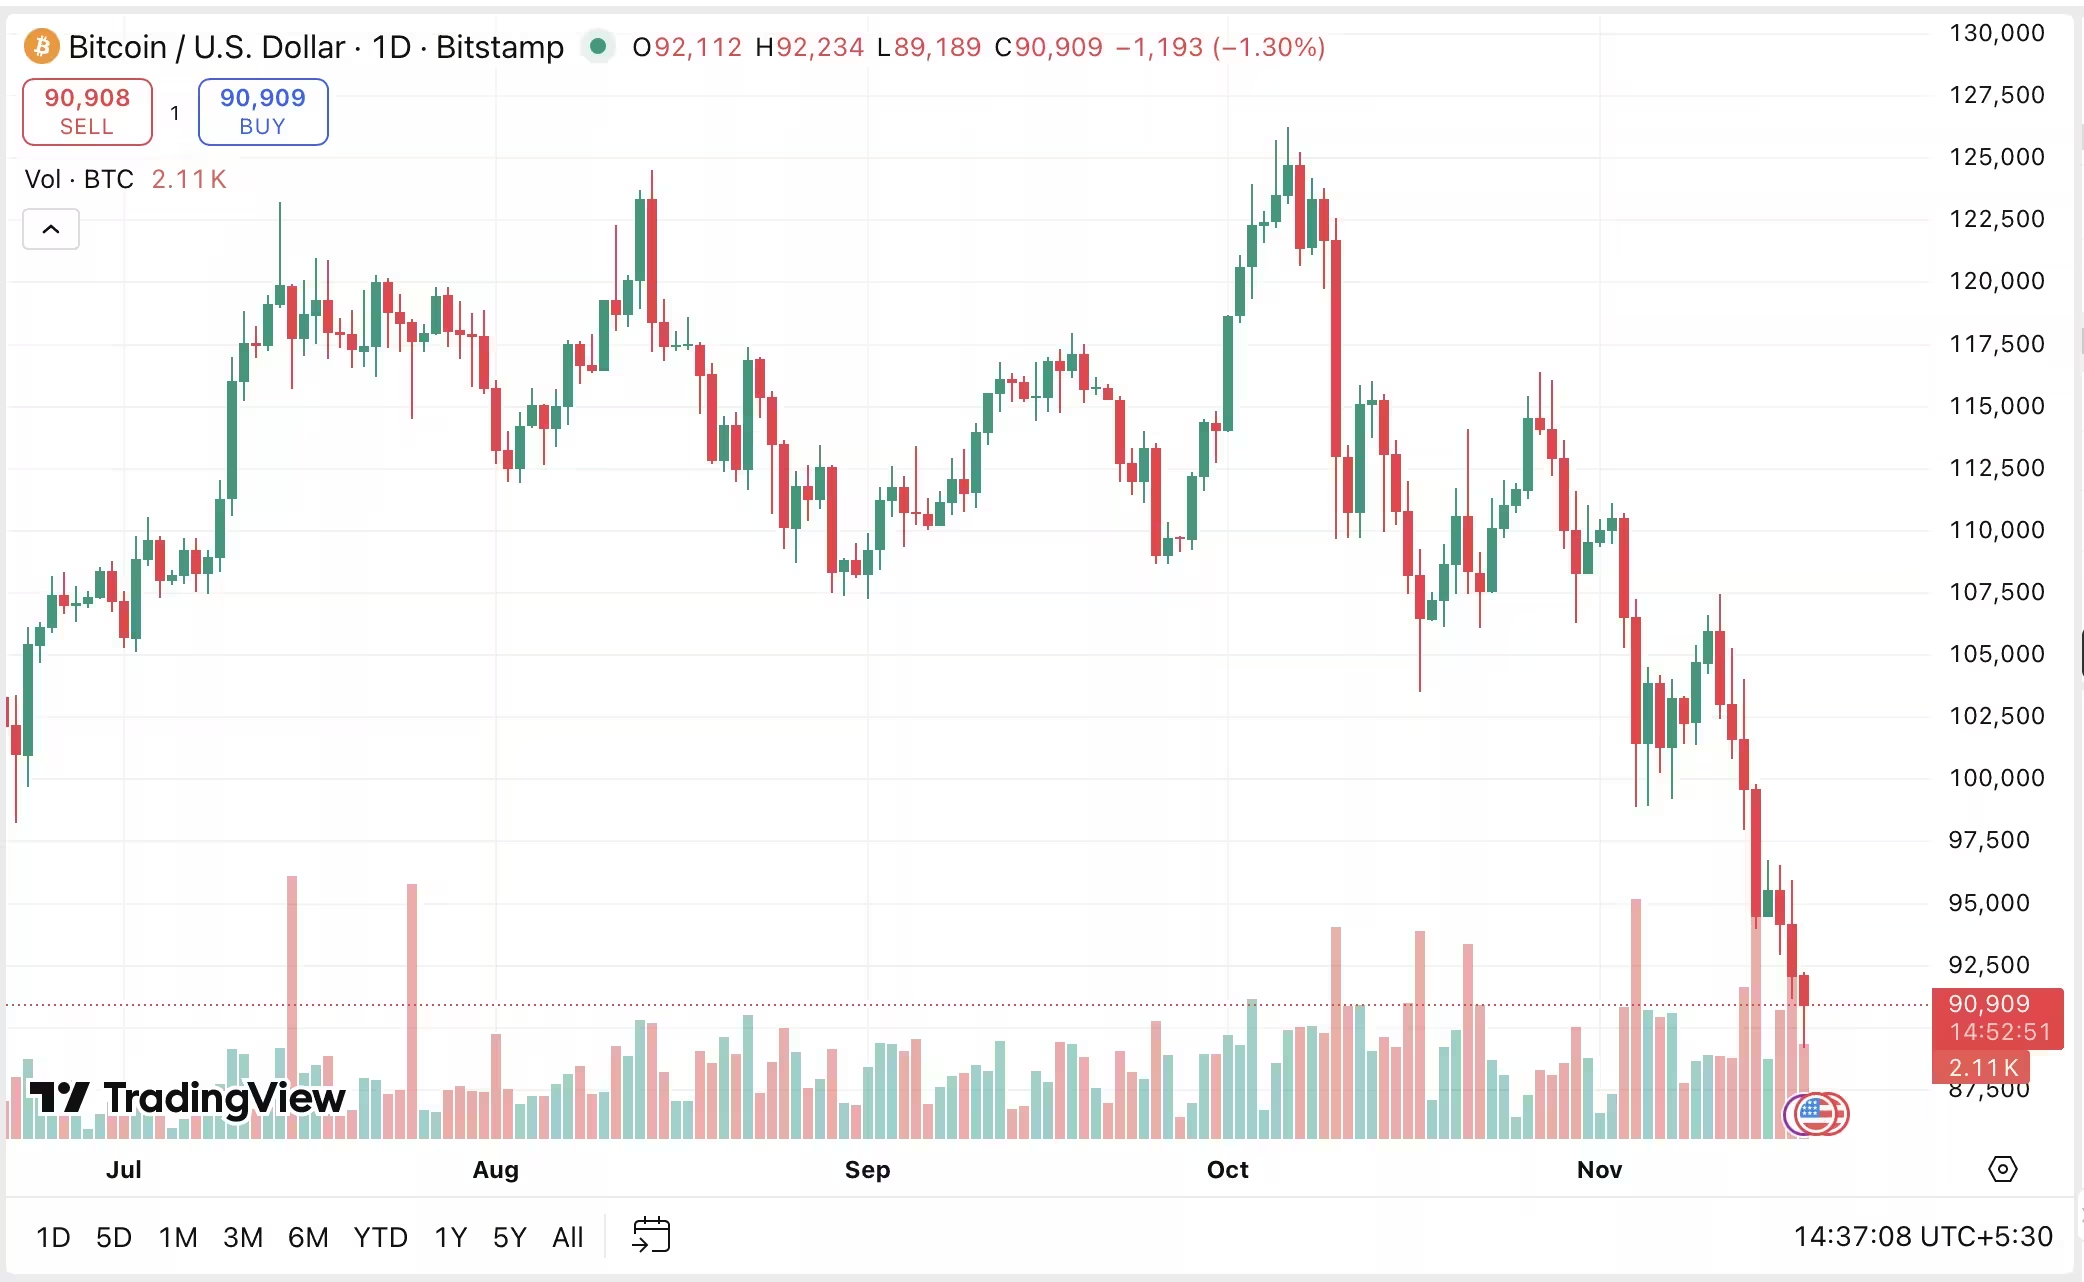
BTC price chart
What the death cross means for price action
The death cross itself is a simple moving average cross: the 50-day MA crossing below the 200-day MA. Historically it has sometimes preceded extended bear phases, most notably during 2022. However, recent cycles show that not every death cross leads to a sustained downturn. Analysts now debate whether this pattern signals a deeper correction or a short-lived pullback within a longer-term uptrend.
MVRV and realized price point to potential support
On-chain indicators add context. Bitcoin has slipped below its MVRV mean, a valuation metric that compares market capitalization to realized capitalization, which often flags undervalued zones when breached. Realized price and past deviation bands mark potential lower floors where market participants historically found value. If selling pressure continues, these realized-price zones and earlier deviation levels are the primary areas to watch for possible bottoms.
Analyst views: divergence on direction and timing
Analyst Ali Martinez highlighted that prior death crosses tended to reverse over the past year, producing renewed rallies. Martinez also pointed out that the 2022 death cross preceded a prolonged bear market and that recent price behavior shares similarities in pace and structure to that earlier decline. Using cycle history, Martinez mapped three lower price zones that could be reached if weakness persists, and suggested a potential cycle low could arrive roughly 12 months after a late-2025 peak.
Counterpoint: moving averages losing edge
Other analysts offer a different read. Egrag Crypto argues that moving averages no longer carry the same predictive weight amid changing exchange flows, macro liquidity, and new market participants. From this perspective, the market remains structurally intact so long as price holds above the 21-week EMA. The recent drop may be a retest of long-term support, and a rebound toward key Fibonacci extensions, including the 1.618 level, remains in play if buyers re-enter.
On-chain flows and trader implications
Exchange inflows have ticked higher, which some interpret as rising sell-side pressure. That said, order book dynamics and derivative positioning will determine whether a technical breakdown evolves into a deeper retracement. For traders and investors, combining moving averages with on-chain metrics like MVRV, realized price, and exchange transfers can offer a clearer risk-management framework than relying on a single indicator.
In short, the death cross raises caution, but it is not an automatic signal of doom. Watch realized-price support, MVRV bands, the 21-week EMA, and exchange flows to judge whether this is a corrective pause or the start of a lengthier decline.


Leave a Comment
Comments
No comments yet. Be the first.