

XRP hovers near $1.25 as investors weigh ETF inflows
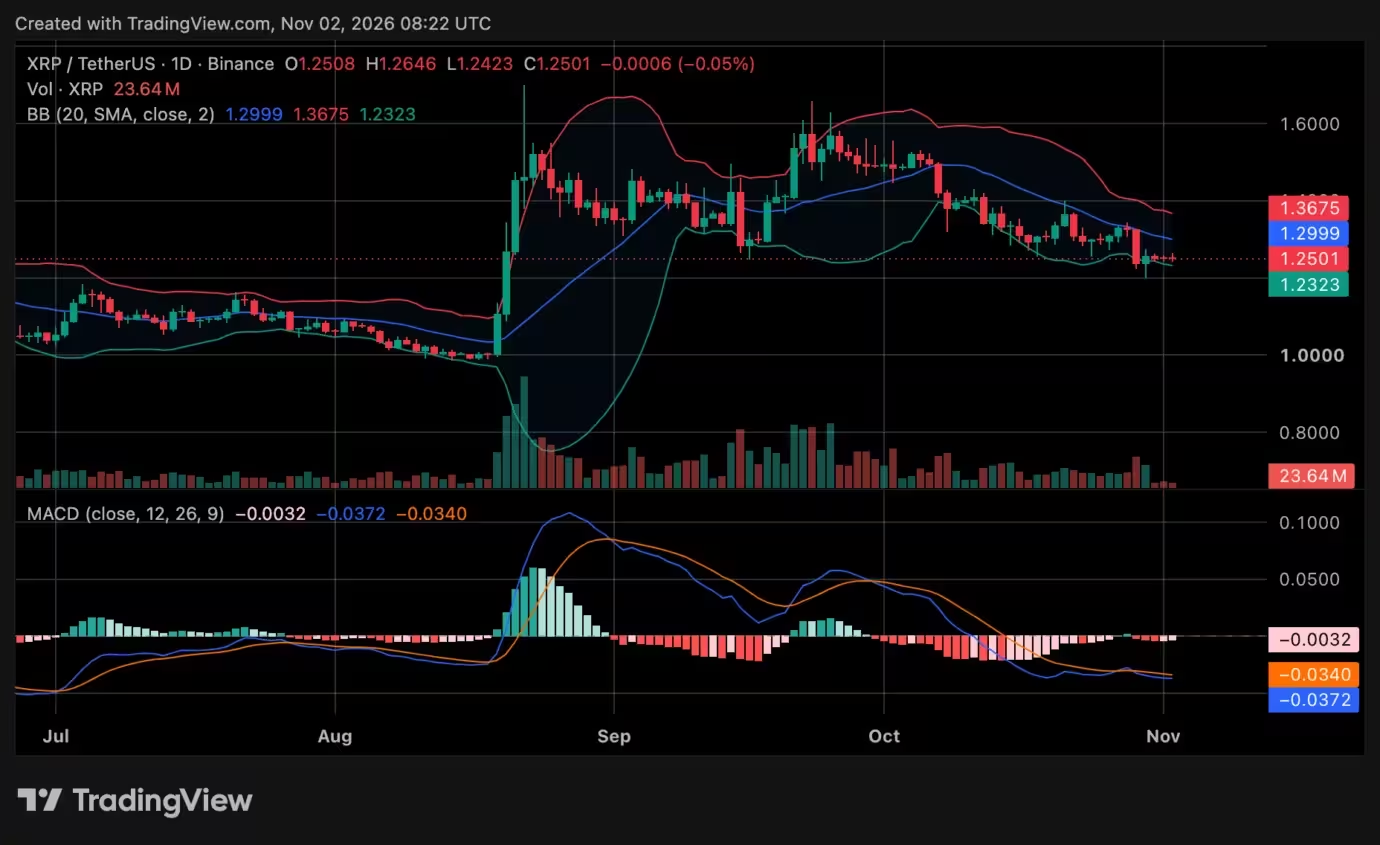
XRP opened November trading around $1.25 after a month that erased roughly 15–16% of its value. The token changed hands in a narrow $1.24–$1.26 range on November 2, leaving markets to question whether the $1.2323 support level can hold and prevent a repeat of October’s steep retracement.
Despite the price weakness, U.S. spot XRP exchange-traded funds continued to attract capital through October. That juxtaposition — steady ETF subscriptions alongside a falling spot price — highlights the complex dynamics between regulated product demand and on-chain or exchange-driven selling pressure.
ETF flows: steady but muted
Data from SoSoValue shows U.S. spot XRP ETFs recorded $18.83 million in net inflows during October, marking the seventh straight month of positive subscriptions. Those inflows included $4.32 million in the final week of October, following about $4.25 million the week before. Cumulative net inflows for the products reportedly stand near $1.81 billion.
Among providers, Bitwise leads with around $682 million in cumulative inflows, Franklin Templeton’s XRPZ follows with $524 million, and Canary Capital’s XRPC holds roughly $485 million. While October’s $18.83 million beat only January’s weaker $15.59 million, the consistent, if modest, subscriptions indicate continued institutional or retail appetite for regulated XRP exposure.
That said, mid-October demand softened: funds saw a $1.84 million weekly withdrawal during Oct. 12–16, which interrupted a 13-week streak of positive weekly subscriptions. Subsequent inflows regained some ground, but the overall picture shows inflows have not yet translated into a decisive price recovery.
Technical picture: support, resistance and indicators
On the daily XRP/USDT chart, the token sits below the 20-day moving average. The Bollinger Bands currently place the 20-day MA at $1.2999, the lower band at $1.2323 and the upper band at $1.3675. A breakdown beneath $1.2323 would put immediate support at risk, while a rally above $1.2999 would signal a return to short-term consolidation or a potential recovery attempt.
Momentum indicators remain tilted toward sellers. The Moving Average Convergence Divergence (MACD) is negative, with the MACD line at -0.0372, the signal line at -0.0340 and a histogram reading of -0.0032 — evidence that bearish pressure has not yet fully subsided. Daily trading volume on the chart showed about 23.64 million XRP, and recent candles displayed limited price movement, suggesting indecision among traders.

Historical seasonality and analyst perspectives

Historical patterns are mixed. Crypto analyst Carolina pointed out that XRP’s monthly Relative Strength Index (RSI) recently approached values that have preceded past turning points during the token’s 13-year history. Carolina named potential long-term price targets of $1.50, $3.50, $7.00 and $14.00, but she cautioned these are contingent on stronger buying momentum and fresh capital inflows. An oversold RSI alone does not confirm a market bottom.
Independent analysis by EGRAG Crypto placed October 2026’s ~16% decline among XRP’s weakest Octobers since 2013 — the fourth-worst on record. EGRAG’s review of seasonal returns shows that seven of 13 completed Novembers between 2013 and 2025 ended negative, while six delivered gains. These historical data produced a long-run average November return of 78.3% skewed by several outlier rallies (notably +489.1% in 2013 and +282.9% in 2024) with a median decline of 9.1%.
EGRAG suggested the token could see weakness in the first half of November followed by a rebound later in the month, but the analyst emphasized that historical outcomes do not guarantee future performance.
XRP price chart
On-chain data and whale activity
Large-holder behavior has added another layer of complexity. CryptoQuant analyst Darkfost noted a seven-month high in large XRP deposits to Binance during October, with the monthly average value of large transfers reaching about $112.4 million. While increased exchange inflows can signal intent to sell, transfers alone don’t prove tokens were sold.
Wallet-level data also shows fewer very large holders: the count of addresses holding between 10 million and 100 million XRP fell from 351 to 339. Concurrently, exchange balances increased by roughly 47 million XRP, per data shared by analyst Ali Charts. These dynamics — fewer super-accumulators but higher exchange balances — reinforce the picture of mixed positioning among whales and institutional holders.
What this means for price action
- If exchange deposits translate into selling, XRP could revisit and potentially breach the $1.2323 support, leading to lower levels.
- If ETF demand and fresh buying absorb selling pressure, a decisive move back above $1.2999 would increase the odds of a sustained rebound toward the $1.35–$1.40 area.
Bottom line: watch $1.2323 and ETF flows
XRP’s immediate trading range centers around $1.25, with the lower Bollinger Band at $1.2323 and the 20-day moving average at $1.2999 as of the November 2 snapshot. Traders and investors should monitor ETF subscription trends, large transfer activity, on-chain exchange balances and short-term technical signals (Bollinger Bands, MACD, RSI) to assess whether current support holds or a deeper correction unfolds.
A measured approach is warranted: ETF inflows point to continued demand through regulated channels, but technical indicators and some on-chain signals suggest sellers still hold the near-term advantage. For bullish scenarios, stronger volume on rallies and continued inflows into spot XRP ETFs will be essential to push price back through resistance and validate higher target levels.


Leave a Comment
Comments
No comments yet. Be the first.