

Bitcoin price outlook: Can BTC retake $85,000?
Bitcoin (BTC) has staged a modest rebound, trading near $82,500 as market sentiment improved after strong tech earnings and renewed interest in AI-related semiconductors. However, technical indicators and derivatives positioning show that several resistance layers stand between the current price and an $85,000 breakout. Traders and investors remain split on whether this recovery can extend into a sustained trend or whether renewed selling pressure will push BTC back into its recent range.
Key takeaways
- BTC recovered above $82,000 but remains below resistance near $83,100 and the broader $84,000–$85,000 zone.
- SoSoValue data recorded $23.16 million in ETF inflows on October 20, with cumulative net inflows at $57.43 billion.
- Crypto Rover flagged more than $2 billion in potential short-liquidation liquidity between $84,000 and $85,000.
- Rekt Capital warned a weekly close below ~$82,200 could signal further downside within the weekly range.
- Daily Bollinger Bands and MACD signals point to a fragile recovery with limited bullish momentum so far.
Market context: stocks, earnings and ETF flows
The latest upswing in Bitcoin coincided with stronger-than-expected corporate results and forward guidance from major technology companies, including names such as SpaceX suppliers and Super Micro Computer, which helped lift risk appetite across equity markets in Asia. Semiconductor stocks benefited from renewed AI spending narratives, supporting a broader risk-on sentiment that often correlates with crypto inflows.
Spot Bitcoin exchange-traded funds (ETFs) also played a role in recent volatility. U.S. spot BTC ETFs reported a big inflow day on October 19, with $526.60 million in net inflows—their largest session since late September. BlackRock’s iShares Bitcoin Trust accounted for $665.2 million of that move, while Fidelity’s FBTC and Grayscale’s GBTC saw withdrawals of $83.6 million and $54.9 million respectively, partially offsetting the inflow surge.
Inflows cooled considerably the next day: SoSoValue recorded $23.16 million in ETF inflows on October 20, bringing cumulative net inflows to $57.43 billion and total ETF net assets to about $106.28 billion. Daily trading volume across ETFs slipped from $2.09 billion to $1.92 billion. October has been uneven for fund demand—mid-month saw notable outflows totaling $228.4 million for investment funds during October 12–16, according to weekly ETF data.
Bitcoin traded around $82,500 at the time of reporting, up roughly 1.24% over 24 hours but about 1.30% lower for the week, according to crypto.news market data.
Derivatives landscape: liquidation risk and leverage
Derivatives positioning remains a focal point for traders assessing short-term risk. Crypto Rover highlighted a concentration of potential short-liquidation liquidity between $84,000 and $85,000, estimating more than $2 billion in vulnerable short positions if BTC moved into that range. Such estimates come from modeling derivatives book structures and should be interpreted as potential pressure points rather than guaranteed outcomes.

Separately, Bitfinex data showed BTC futures open interest rose 4.3% between October 12 and 15 even as spot prices weakened—signaling that leverage increased despite softer spot demand. Several analysts have cautioned that rising leverage in a low-demand environment can amplify liquidation cascades if price momentum reverses.
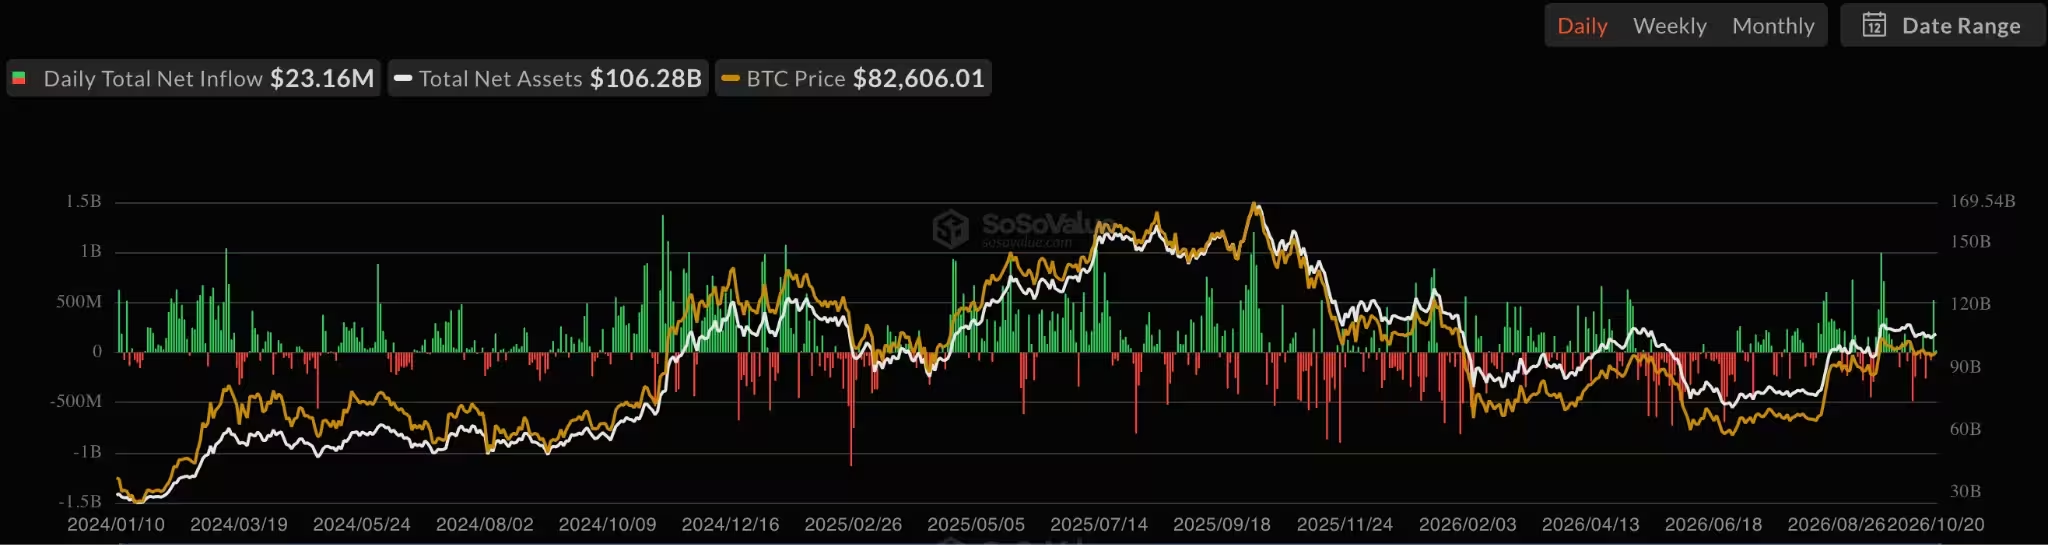
Bitcoin spot ETF net inflow
Technical picture: resistance and support levels to watch
Technically, BTC’s immediate path is defined by a cluster of resistance and support levels. The daily chart places BTC under the 20-day simple moving average after a rejection near $88,000. Bollinger Bands show the middle band at roughly $83,100, the upper band near $86,130 and the lower band around $80,100—indicating a compressed volatility environment and a relatively narrow distance to central resistance.
A daily close above $83,101 would return BTC above the Bollinger middle band and open the way toward resistance at approximately $86,126 and the $88,000 area. Conversely, a decisive break below $80,076 would expose downside targets near $78,000 and $76,000, which would represent a deeper bearish scenario.
The Moving Average Convergence Divergence (MACD) adds caution to the bullish case. The MACD line sits at 52 while the signal line is near 268, producing a negative histogram of -216. Although both MACD components remain in positive territory, the negative histogram signals diminishing bullish momentum versus the signal line—consistent with a market that has recovered some ground but not regained confident buying conviction.
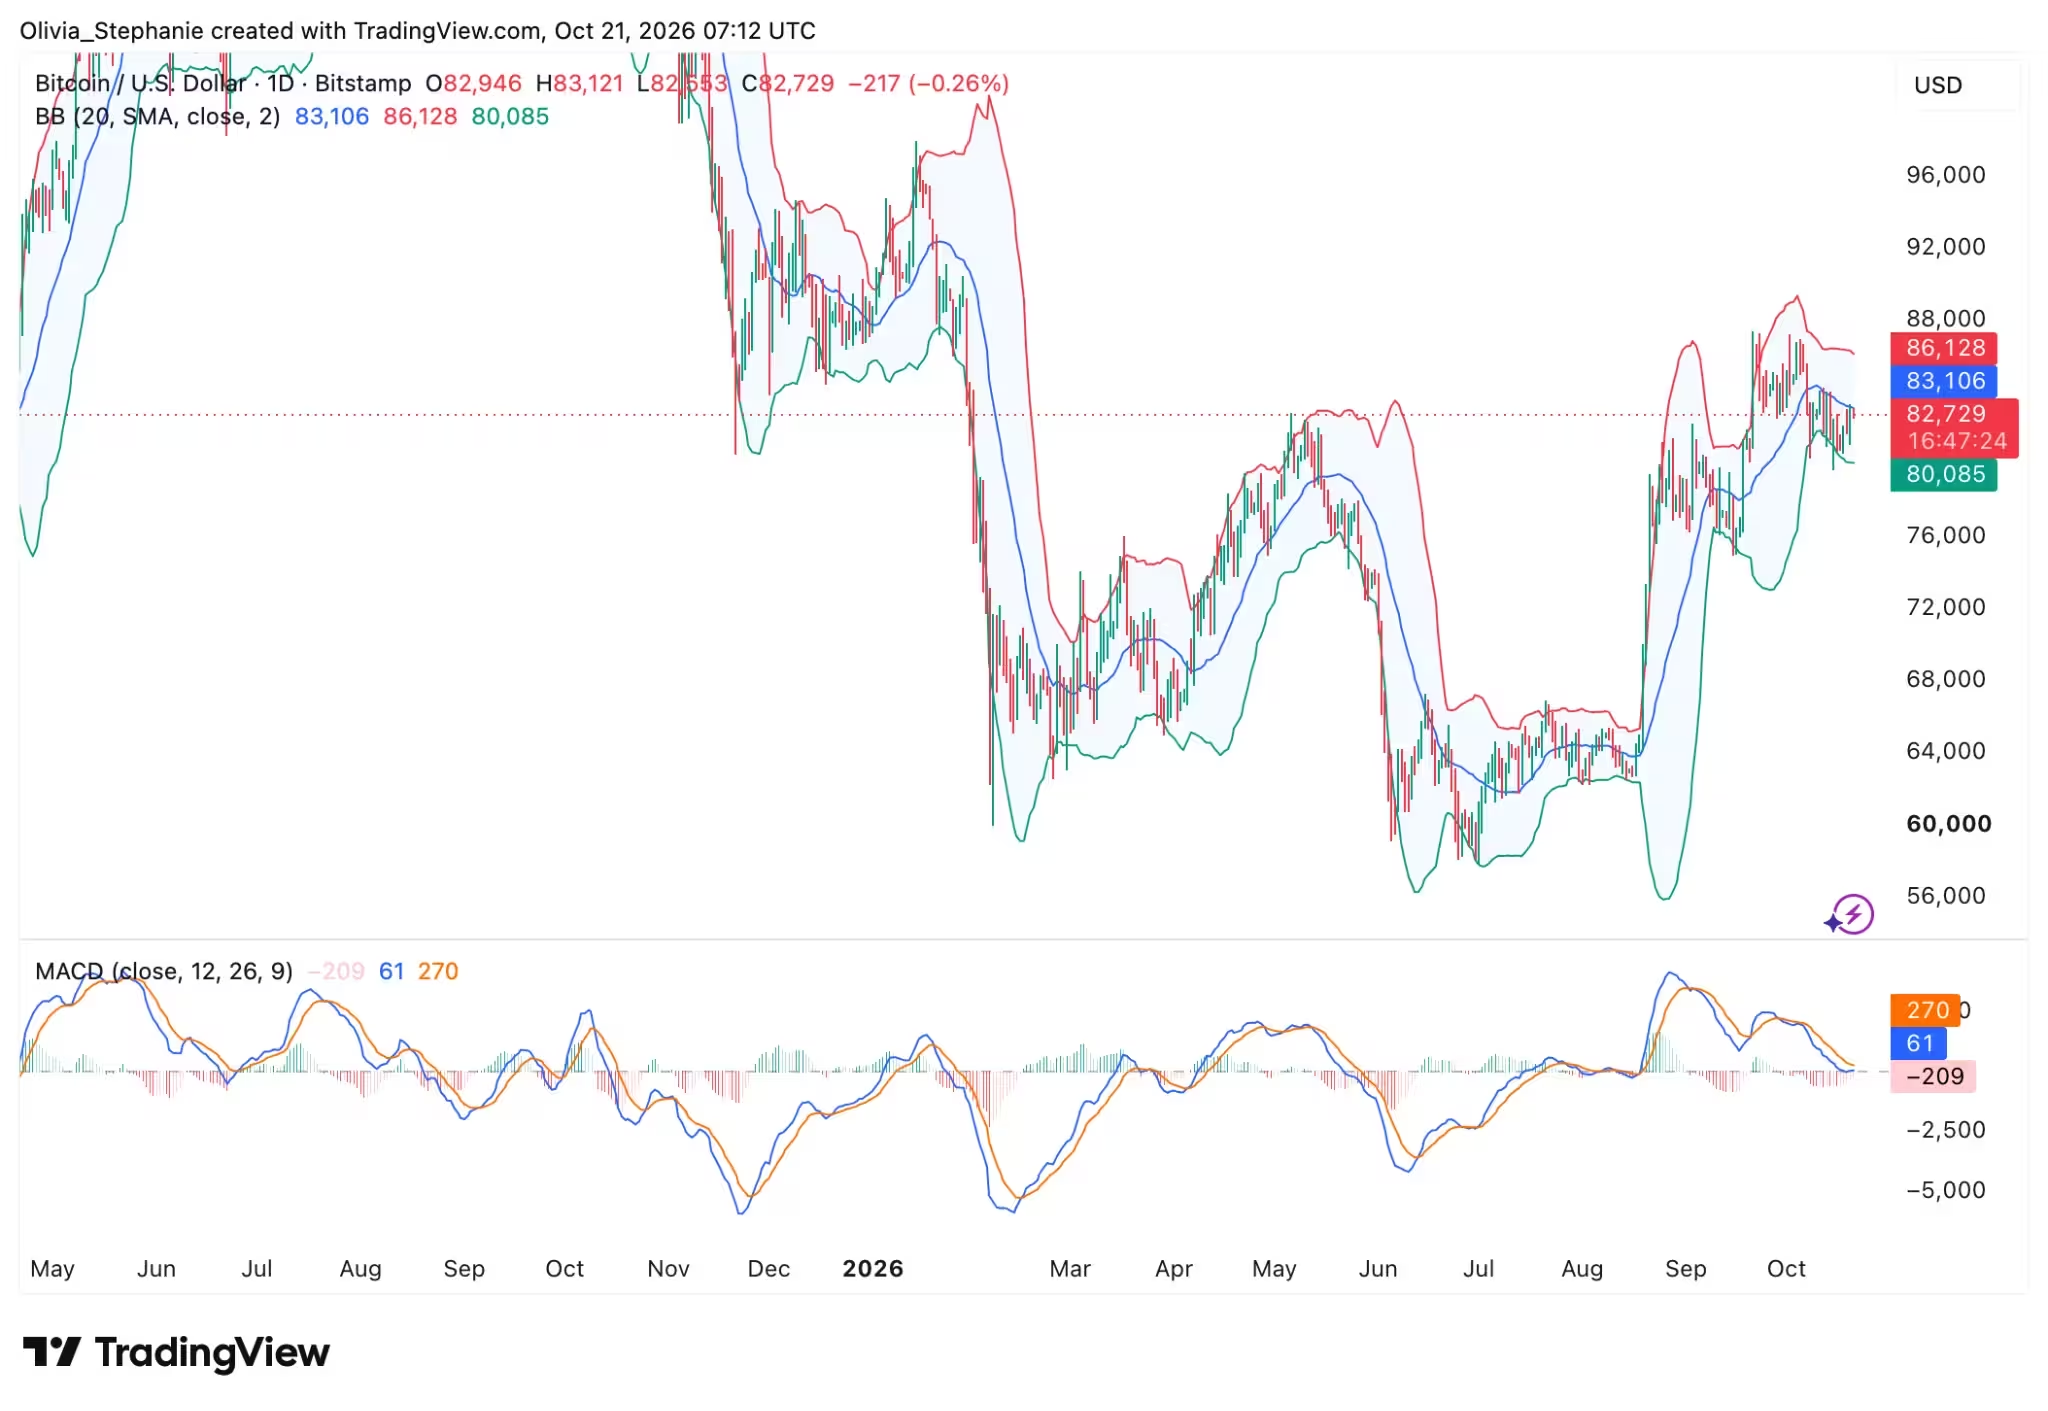
Bitcoin (BTC) price chart

Analyst views: mixed signals from Rekt Capital, Crypto Rover and others
Market commentary has been mixed. Crypto Rover’s note about the $84,000–$85,000 short-liquidation zone suggests event-driven upside could materialize if short squeezes occur. The same analyst also flagged the potential for a bullish ‘‘golden cross’’ pattern, pointing to historical bullish outcomes when such crossovers formed—though precise moving-average settings were not specified and the crossover had not been confirmed at the time of the commentary.
By contrast, Rekt Capital offered a cautious take: a weekly close below roughly $82,200 could convert that level into resistance and increase the probability of a deeper pullback within the weekly trading range. That assessment remains directly relevant while BTC trades close to $82,500. The analyst’s post read:
Another market commentator, Crypto Lens, sketched two speculative price pathways that included levels at $75,000, $67,000 and $105,000—emphasizing these were scenarios rather than firm forecasts and did not include specific timelines.
Macro backdrop and what traders should watch
Macro variables remain important. U.S. Treasury yields were reported above 5% on October 21, and markets continue to digest corporate earnings, oil price moves and borrowing-cost expectations. CryptoQuant’s nocoffeenobrain compared current bond-yield and equity conditions with past episodes that coincided with crypto sell-offs (noting differences in underlying catalysts), underscoring how cross-asset dynamics can influence BTC’s trajectory.
Short term, traders will monitor: daily and weekly closes around $82,200–$83,100, ETF flow momentum, futures open interest changes, and any price action that forces short-liquidations around the $84,000–$85,000 band. A confirmed break above the middle Bollinger band and rising MACD histogram would strengthen the bullish case. Alternatively, successive weekly closes below identified support could trigger larger downside moves.
Bottom line
Bitcoin’s recent bounce shows resilience, but the path back to $85,000 remains guarded by technical resistance and crowded derivatives positioning. ETF flows and macro conditions can tip the balance quickly—either into a short squeeze that clears $84k–$85k resistance, or into a bearish retest of lower weekly support. Traders should combine on-chain and derivatives signals with classical technical levels when sizing risk and preparing for potential volatility.


Leave a Comment
Comments
No comments yet. Be the first.