

ETH tumbles after hotter-than-expected U.S. CPI
Ethereum fell sharply on October 15, sliding roughly 6% to about $2,350 after a hotter-than-anticipated U.S. Consumer Price Index (CPI) print sparked heavy selling across crypto markets. The move triggered a concentrated wave of leveraged liquidations on Binance, with CryptoQuant analyst Darkfost reporting more than $106 million in long ETH positions closed within a single hour.
This article examines the market reaction, derivatives and ETF flows, on-chain activity, and technical indicators traders are watching as Ethereum tests potential support around $2,300.
What happened: CPI surprise and the liquidation cascade
The September CPI reading came in higher than consensus, accelerating month over month. The immediate market response was risk-off across equities and digital assets, and leveraged participants in crypto derivatives markets were most exposed. Several data and on-chain monitors pointed to a concentrated liquidation event on Binance as prices dropped.
CryptoQuant's reporting emphasized that the $106 million figure refers to the notional value of liquidated long positions on Binance during a one-hour window after the CPI release. That number is not the same as traders' out-of-pocket losses, since liquidations close leveraged positions using collateral and exchange margin mechanisms.
Why liquidations intensified the move
When prices move rapidly, automatic liquidation engines on centralized exchanges close out highly leveraged positions to protect lenders and prevent negative account balances. These forced sell orders can further amplify price declines, creating a feedback loop between falling spot prices and derivatives activity. In this instance, CryptoQuant also noted that derivative volumes were multiple times greater than spot activity, increasing market sensitivity to short-term shocks.

Price action and market metrics
Following the CPI release, Ethereum slid from near $2,500 to around $2,350 in the period monitored by analysts, a drawdown of roughly 7% over the immediate interval. CoinGecko and other price trackers recorded ETH trading near $2,350, a 24-hour fall of about 6% and a weekly decline exceeding 8%.
At that level, Ethereum's market capitalization was close to $287 billion, while 24-hour trading volume hovered near $18.4 billion. Some trade prints briefly showed ETH near $2,315, the lowest since the token's rally earlier in August.

Derivatives vs spot: leverage amplifies volatility
Analysts highlighted that derivatives trading — futures and perpetual contracts — was roughly nine times larger than spot trading over the observed period. High relative derivatives volumes increase the likelihood that large liquidations and repositioning by market makers will cause outsized spot price moves. Traders using borrowed capital to take directional bets are especially vulnerable when macroeconomic surprises arrive.
U.S. inflation details and macro implications
The U.S. Bureau of Labor Statistics reported a 0.6% month-over-month CPI increase for September, above the 0.5% consensus and the 0.4% gain in August. Year-over-year headline inflation rose to 3.7% from 3.4%.
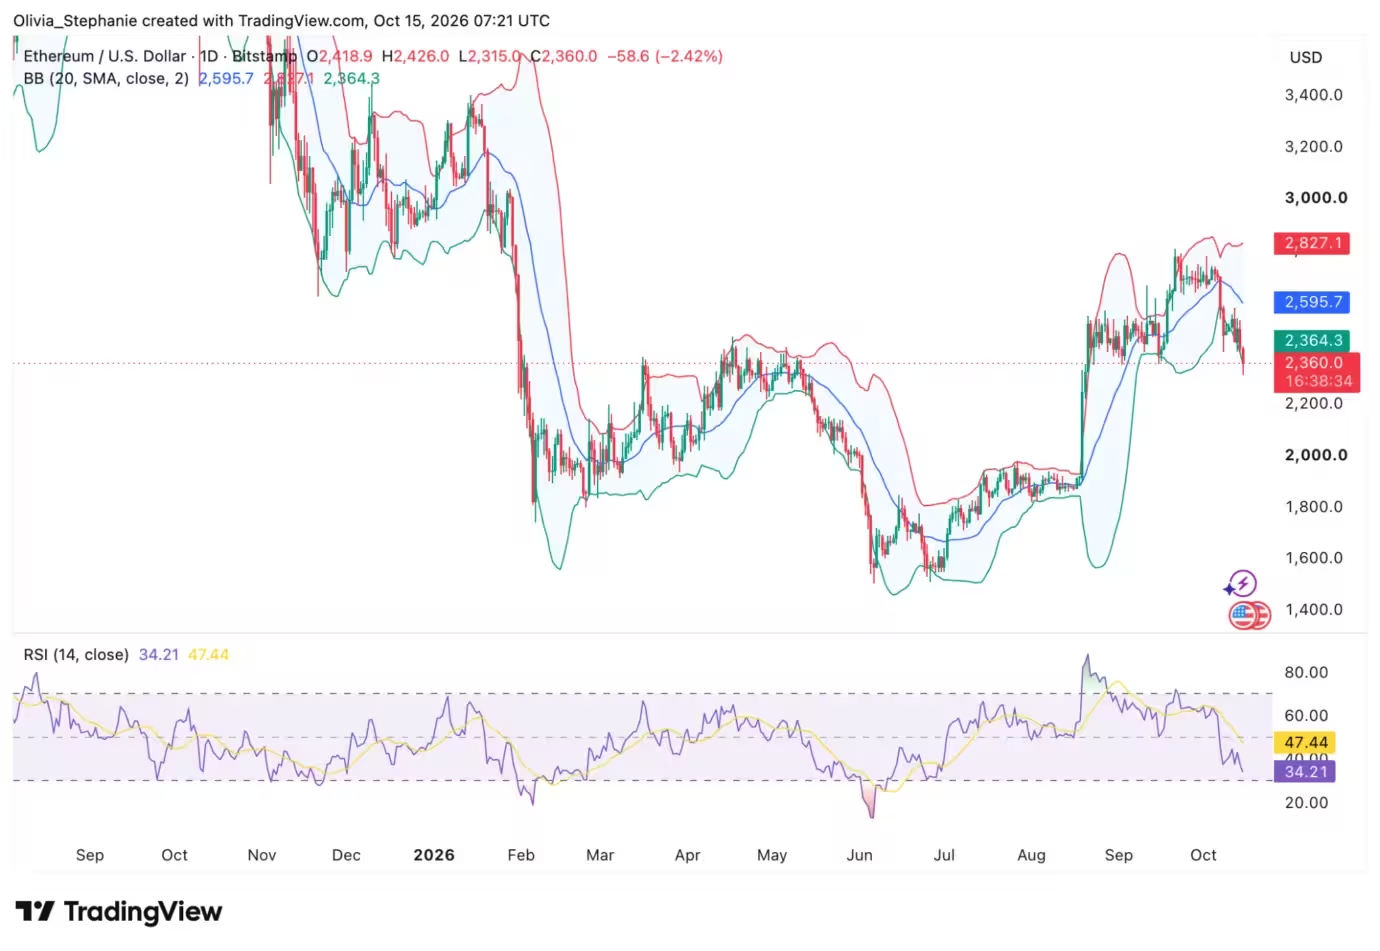
Ethereum price chart
Core CPI, which strips out volatile food and energy components, climbed 2.6% over the prior 12 months, up from 2.4% in the previous month. Energy was a major driver of the monthly uptick: gasoline prices surged 9.1% for the month and were up 34.2% year over year, while fuel oil jumped 74.2% over the same period. Shelter costs and airline fares also contributed to the increase.
These inflation dynamics prompted markets to reassess the path of Federal Reserve policy. Darkfost estimated that the probability priced into markets for an additional Fed rate hike increased markedly in the days leading up to the October policy meeting, pushing traders to adjust leveraged positions accordingly.
Fed calendar and investor focus
The Federal Reserve has a policy meeting scheduled for October 28, with markets watching for guidance on rate trajectory. The next CPI update for October is due on November 10, which will again be a focal point for traders, especially those managing high-leverage positions in both crypto and traditional markets.
ETF flows and institutional activity

The selloff in Ethereum coincided with net outflows from spot ETH exchange-traded funds, adding to pressure on the token. After U.S. spot ETH ETFs recorded modest inflows of about $24.8 million on October 13, provisional data showed roughly $130 million in net outflows on October 14. BlackRock's iShares Ethereum Trust (ETHA) reportedly led withdrawals with about $110 million redeemed.
Earlier in October, tracked U.S. crypto investment products saw roughly $1.29 billion in combined outflows during October 5–9, a period that pressured prices and tested investor conviction behind the ETF narrative.
Why ETF flows matter
Institutional demand via spot ETFs has become an important liquidity and sentiment signal for Ethereum. Large and sudden redemptions can create selling pressure in the market, while inflows support prices by increasing spot demand and positive narrative momentum among allocators and long-term holders.
Short positions, market makers, and on-chain snapshots
Derivative markets showed an uptick in short interest following the CPI release. Crypto analyst Daan Crypto Trades noted that open interest and short positions expanded as ETH moved lower, though many short positions appeared steady rather than aggressively leveraged to trigger immediate squeezes.
$ETH Open Interest has ramped up hard after the CPI print.
A lot of shorts that piled into the downside momentum. Most of them are sitting comfy and steady so don't expect a squeeze straight away.
Blockchain research accounts also flagged sizable short exposure from market makers on decentralized platforms. Onchain Lens reported roughly $75 million in short positions attributed to market maker Wintermute on the Hyperliquid derivatives venue, representing a significant component of the platform's open positions.
These snapshots are moment-in-time views; market makers and institutional desks can change position sizing rapidly as liquidity demands and hedging needs evolve.
Technical picture: support, RSI, and Bollinger Bands

From a technical standpoint, Ethereum approached a critical support zone around $2,300. Short-term momentum indicators showed weakness: the relative strength index (RSI) printed near 34, well below neutral 50 and approaching the widely watched oversold threshold of 30.
A supplied chart at the time placed ETH trading just below the lower Bollinger Band, suggesting the move had taken prices outside the typical short-term volatility envelope. Bollinger Bands were stretched, with the lower band near $2,363, the middle band around $2,595, and the upper band close to $2,828 — readings that signaled elevated volatility and a wide trading range.
Key levels traders are watching
- Immediate support: $2,300. A decisive break below this level on strong volume could open the door to further downside.
- Short-term recovery trigger: reclaiming the lower Bollinger Band near $2,363 would be an initial sign of stabilizing price action.
- Next resistance zones: reclaiming the middle Bollinger Band around $2,595 and then the psychologically and technically significant $2,800–$2,850 area.
Historically, oversold RSI readings can precede bounces, but they are not reliable on their own. The broader macro backdrop, derivatives positioning, and ETF flows will likely determine whether a meaningful rebound or further consolidation follows.
Implications for traders and long-term holders
Short-term traders faced heightened risk as macroeconomic surprises collided with high leverage and concentrated derivatives liquidity. Volatility spikes like this tend to favor sophisticated market participants, including market makers and institutional desks that can provide margin and liquidity when retail leverage unwinds.
For longer-term investors, the episode serves as a reminder that macro factors — inflation data and central bank guidance — continue to influence crypto prices alongside on-chain fundamentals and adoption narratives such as staking, Layer 2 growth, and institutional ETF adoption.
Risk management takeaways
- Monitor macro calendar: CPI prints, Fed meetings, and other economic releases can move crypto markets sharply.
- Manage leverage carefully: high leverage increases the chance of liquidation during volatility spikes.
- Watch ETF flow reports: sudden outflows or inflows can amplify directional moves in spot markets.
- Track on-chain and derivatives metrics: open interest, funding rates, and exchange-specific liquidations reveal where pressure may build.
Outlook: what to expect next
In the near term, Ethereum is likely to trade in a heightened volatility regime as markets price in the Fed's next moves and digest incoming macro data. ETF flows and derivatives positioning will remain crucial to price dynamics; any renewed inflows could help stabilize ETH, while continued outflows and increased short exposure could extend downward pressure.
Key data points to watch include the October 28 Fed meeting, the next CPI release on November 10, and updates to ETF flows and derivatives open interest. On-chain metrics and order book depth across major exchanges will also inform how resilient support near $2,300 proves to be.
Conclusion

Ethereum's roughly 6% drop after the hot CPI print underscores how macro surprises can reverberate through crypto markets, especially when leverage is elevated and derivatives volumes far outstrip spot liquidity. The $106 million in Binance long liquidations within one hour is a stark illustration of how forced position closures can amplify moves. Traders and investors should remain attentive to macro signals, ETF flows, and on-chain and derivatives indicators as they assess risk and opportunity in ETH and broader crypto markets.

Leave a Comment
Comments (2)
Wow that liquidation cascade was brutal! ETH sliding fast, leveraged traders got roasted. hope some smart liquidity providers bought the dip, damn
Hot CPI then $106M liquidations in an hour? ok but are Binance numbers double counted or just notional? curious about real P&L here, seems a bit inflated