

XRP stalls at $1.36 after a week of selling pressure
XRP has slipped to roughly $1.36 after falling 6.91% over the past seven days, according to CoinGecko market data. The token sits below the critical 1.38–1.40 zone, where multiple technical indicators point to ongoing selling momentum despite rising whale-related withdrawals from major exchanges. Short-term trading volume, price action, on-chain flows and social sentiment together paint a cautious outlook for XRP as traders weigh whether the token can reclaim higher resistance levels in the coming sessions.
Market snapshot and immediate levels
CoinGecko data shows XRP down about 0.13% over 24 hours with daily trading volume near $1.72 billion and a market capitalization of roughly $86.06 billion, ranking the token fifth among digital assets. Trading activity declined almost 19.70% from the prior day, and analysts have identified $1.35 as immediate support.
Price structure highlights:
- Current price: ~ $1.36 after a seven-day decline of 6.91%.
- Immediate support: $1.35, followed by a buying band between $1.30 and $1.32.
- Deeper downside zones: $1.20–$1.25, with $1.13 and $1.00 cited as potential drop targets if support breaks.
- Immediate resistance: 1.38–1.40; above that, $1.45 and the 1.50–1.60 region that capped the September rally.
XRP has produced lower highs since its September attempt toward $1.60, indicating buyers have struggled to sustain upward momentum after recovering from August lows near $1.00. In the most recent daily session XRP opened around $1.36480, briefly touched $1.38518 and then retreated, reinforcing the 1.38–1.40 region as a short-term ceiling.
Technical indicators: sellers retain the edge
Several on-chart indicators signal that sellers are still in control. The Balance of Power (BoP) on the daily chart reads about -0.07, a slightly negative value that suggests selling activity marginally outpaced buying during the measured period. While this reading is near neutral, its negative state aligns with XRP's inability to close convincingly above $1.40; a move into positive BoP would be an initial sign of improving demand.
The Awesome Oscillator further confirms deteriorating short-term momentum. The indicator is at approximately -0.06068, with red histogram bars below the zero line. During September's push toward $1.60 the oscillator moved into positive territory as buying strength increased. The subsequent price decline pushed it back below zero, indicating that the prior recovery lost steam.

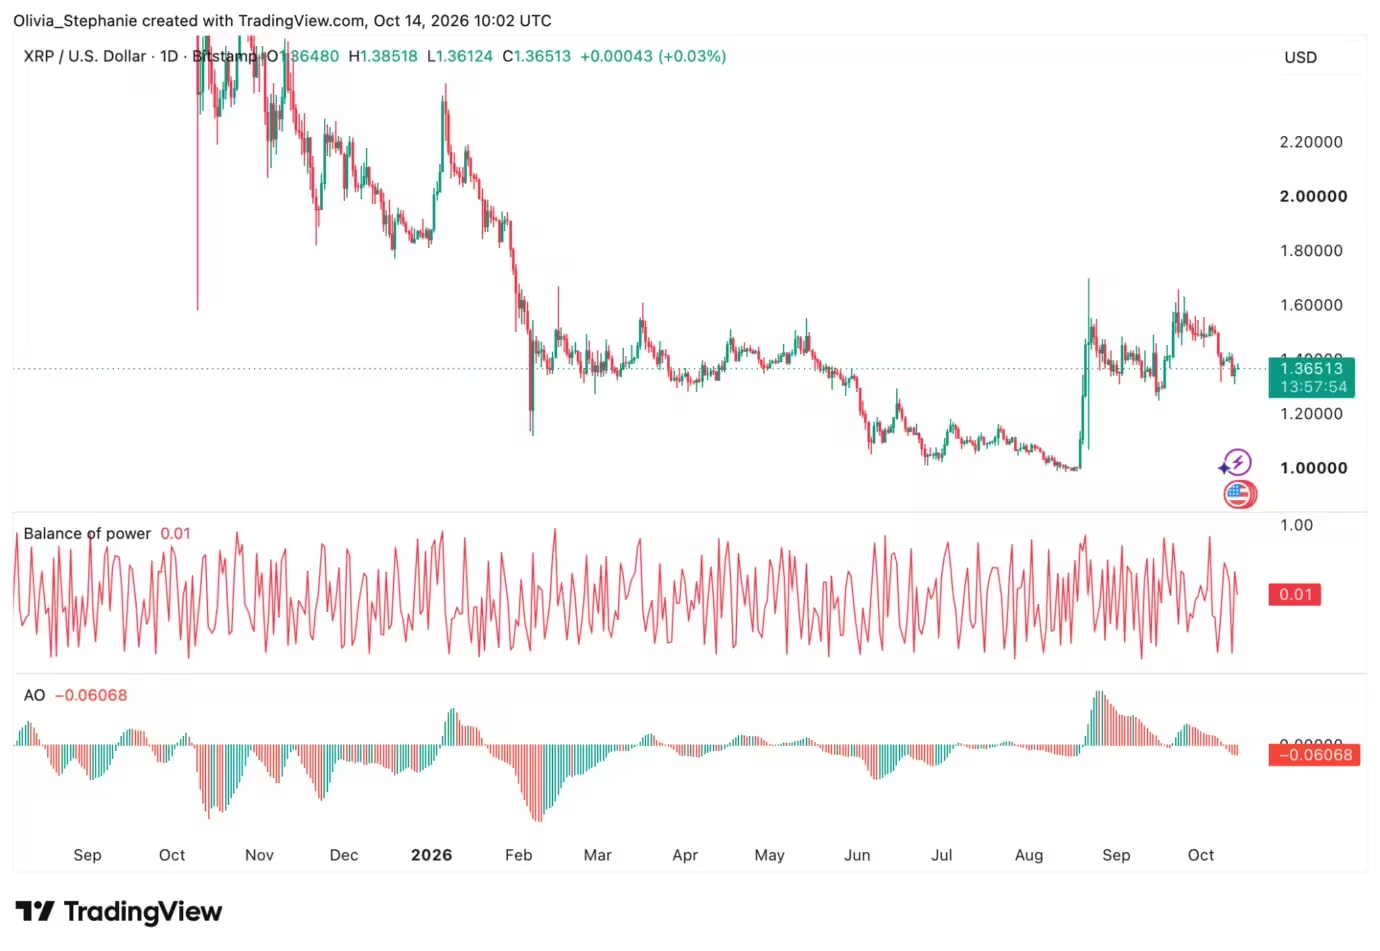
XRP price chart
Sustained further negative oscillator readings would raise the probability of a retest of the $1.30 area. Conversely, an improvement toward the zero line followed by green histogram bars would provide early technical confirmation that selling pressure is easing and buyers are regaining control. For now, the $1.35 and $1.40 levels are central to the token's near-term outlook: losing $1.35 could extend the correction, while reclaiming $1.40 would give bulls an opportunity to target $1.45 and then the broader 1.50–1.60 zone.
On-chain flow: whale withdrawals accelerate on Binance
Despite the weak price action, exchange flow data shows a notable rise in large XRP withdrawals from Binance. CryptoQuant analyst Amr Taha reported that Binance's seven-day average whale-to-retail outflow spread rose from 53% on October 7 to 63.5% on October 13 — a 10.5 percentage-point increase over six days.
By comparison, the combined metric across all centralized exchanges moved from 46% to 47.7% in the same window, a 1.7 percentage-point rise. Binance's spread therefore expanded roughly 6.2 times faster in percentage-point terms than the combined exchange average for that period. The gap between Binance and the combined exchange market reached about 15.8 percentage points, approaching the roughly 18-point difference observed on August 3.
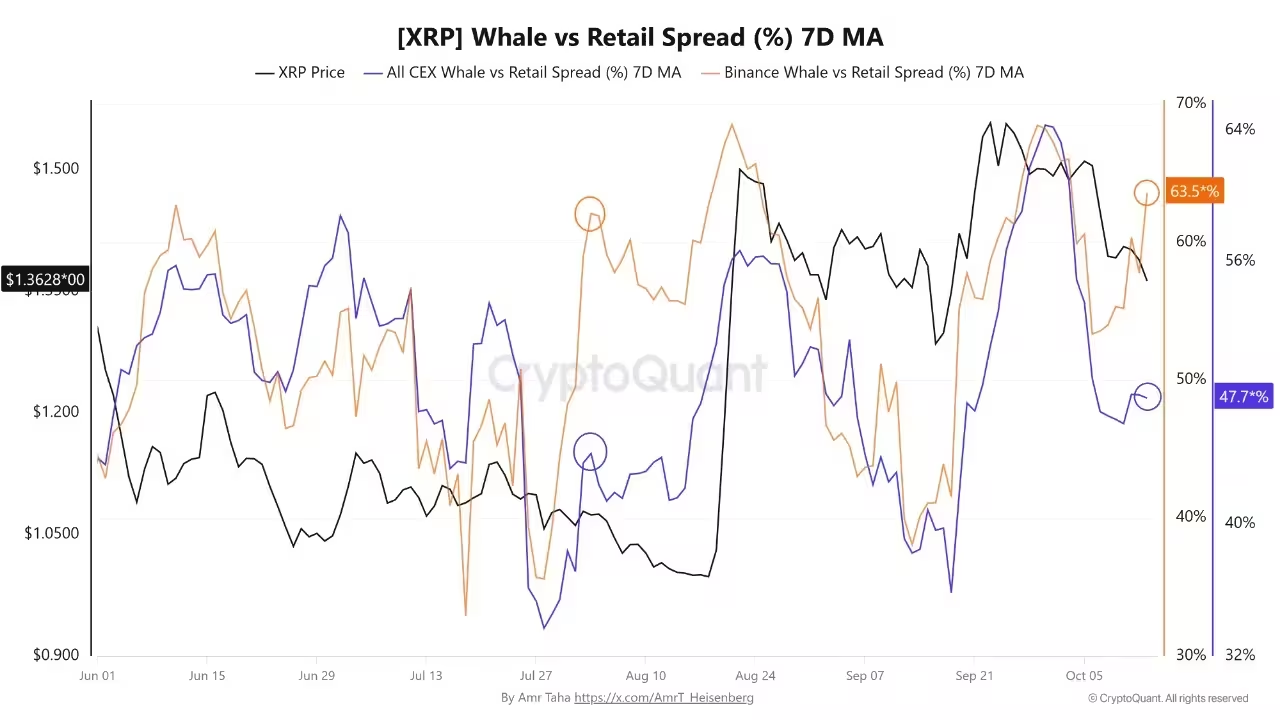
CryptoQuant's whale-to-retail outflow spread compares large and small exchange withdrawals over a seven-day average. A higher reading indicates that large transfers are becoming more dominant relative to smaller withdrawals. Taha cautioned, however, that the metric does not prove absolute increases in whale withdrawals nor does it confirm accumulation: large movements can reflect transfers between exchanges, custody providers and private wallets as well as accumulation by large holders.
Historically, a similar configuration coincided with a strong bounce. On August 3 Binance's spread was near 62% while the combined exchange figure was about 44%, and XRP rose from roughly $1.07 to $1.56 — a gain of about 46%. That historical comparison highlights a potential bullish narrative, but it does not guarantee a repeat.
Separately, some crypto analysts have pointed to signs of accumulation based on moving averages and MACD readings despite ongoing sideways trading. Those assessments suggest improving buyer interest mixed with weaker short-term momentum.
Social sentiment and analyst scenarios
Public sentiment remains cautious. On-chain analytics firm Santiment reported that across X, Reddit and Telegram XRP recorded 0.92 bullish comments for every bearish comment, placing it on the negative side of social sentiment. For context, Bitcoin's ratio was about 0.82 while Ethereum's stood at 2.05 bullish comments per bearish one.
Santiment linked XRP's negative sentiment to its recent price decline, leveraged position liquidations and repeated difficulty reclaiming $1.40. The firm noted that bearish chatter can sometimes create a contrarian setup if on-chain flows and broader market conditions turn favorable, but social commentary alone does not confirm buying activity or a forthcoming rebound.
Crypto analyst EGRAG Crypto offered two scenario paths based on XRP's three-day chart. His bearish case points to $1.13 as an initial downside target if consolidation fails, followed by a potential slide toward $1.00. For a bullish breakout, the analyst identified $2.10 as an early target after an upward breakout, and emphasized a longer-term milestone only if XRP clears $3.68 — a move he suggested could open the door to targets near $17.60 on an extended breakout.
In a separate thread, EGRAG outlined a larger multi-year symmetrical triangle with intermediate upside projections between $4.30 and $10.23 and extended targets including $15.93, $33 and $60. He stressed these are conditional scenarios that depend on confirmed breakouts from larger chart formations and not guaranteed price outcomes. He also acknowledged the possibility that XRP could revisit $1.00 before mounting a durable recovery.
What traders should watch next
Key events and indicators for near-term XRP traders and investors:
- Price key levels: Watch $1.35 as immediate support and $1.40 as the crucial short-term test. A decisive daily close above $1.40 could open the path to $1.45–$1.60.
- On-chain flows: Monitor Binance whale outflow spread metrics from CryptoQuant for signs of sustained large-holder movement off exchanges.
- Momentum indicators: Keep an eye on the Awesome Oscillator and Balance of Power for early shifts from negative to neutral or positive readings.
- Sentiment: Track social metrics from Santiment and other analytics to gauge retail fear or appetite, while treating social data as a complement to on-chain and technical signals.
- Macro and derivatives: Pay attention to futures activity, funding rates and liquidations, since leveraged drama can amplify short-term moves.
XRP remains a widely tracked altcoin due to its market capitalization, active on-chain flows and contentious legal and regulatory narratives surrounding Ripple. For traders, the token's near-term path will likely be decided by a combination of reclaiming key resistance, continued accumulation behavior by large holders, and improving momentum across technical indicators. Until XRP stages a convincing close above $1.40 and demonstrates follow-through, downside risks toward $1.30 and potentially lower remain meaningful.
Bottom line

XRP's current price action at about $1.36 reflects a market caught between stronger whale withdrawals on Binance and subdued retail sentiment. Technicals currently favor sellers, but rising large transfers and past historical patterns leave open the possibility of a renewed push higher if buyers can reclaim $1.40 and sustain momentum. Traders should manage risk carefully, watch the $1.35–$1.40 range closely, and use on-chain flow metrics, sentiment indicators and established technical levels to form a measured plan rather than relying on any single signal.

Leave a Comment
Comments (1)
Is this even true? Binance whale outflows rising but price still stuck, could be wash trading or simple transfers between wallets. Anyone checked the raw txs?