

Bitcoin’s recovery stalls under $85,000 as ETFs and yields sap demand
Bitcoin has clawed back above $84,000 but continues to meet stiff resistance near the $85,000 mark. After several failed attempts to reclaim highs around $87,000, upward momentum has been constrained by weakening institutional demand, elevated U.S. Treasury yields and lingering uncertainty around Federal Reserve policy. Technical indicators point to improving buying pressure, but a decisive breakout above $85,000 is still required for BTC to target higher resistance bands.
Price action snapshot
According to TradingView data, BTC was trading near $84,234 at the time of reporting, up roughly 0.55% on the daily candle after an intraday high near $84,290 and a low close to $83,462. The recovery follows a difficult stretch in which Bitcoin briefly dipped toward $80,000 after repeated rejections close to $87,000.
Market participants attribute the pattern to a mix of reduced spot ETF inflows, heightened Treasury yields that make fixed income relatively more attractive, and a cautious stance ahead of upcoming inflation data that may shape the Fed’s next moves.
ETF flows and institutional interest: the missing fuel
Institutional demand through U.S. spot Bitcoin ETFs weakened considerably in October compared with late September. Weekly inflows that once neared $2.4 billion have collapsed; one analysis showed flows dropping to roughly $241 million for the week ending Oct. 2 — a decline of nearly 90% from the prior peak. That shift matters because heavy spot buying is one of the most reliable drivers of durable price advances in BTC.
Analysts at Bitfinex and Alpha Finance noted that futures markets were active, and open interest rose ahead of key macro events, but that leveraged futures activity did not translate into sufficient spot purchases to sustain rallies. In practical terms, shorts covered and leverage pushed prices higher temporarily, but the lack of broad-based spot accumulation meant rallies ran out of steam once leverage cooled.

ETF flows deteriorated further in early October, with net outflows reported on multiple sessions. There was a modest rebound midweek with roughly $21 million in inflows, but that amount was not enough to counteract prior withdrawals. For Bitcoin to reclaim $87,000 and aim toward $90,000, a return of substantive spot ETF demand will likely be necessary.
Why flows matter for price structure

Spot ETF inflows represent direct buying pressure that reduces circulating supply on exchanges and supports higher prices. By contrast, a futures-driven rally can be more fragile because it often relies on leverage and synthetic demand that can unwind quickly. When inflows slow, resistance zones — like the area between $86,500 and $87,400 — tend to hold longer.
Macro backdrop: Treasury yields, oil and Fed uncertainty
Macro factors are amplifying crypto market caution. U.S. Treasury yields climbed amid rising oil prices and geopolitical tensions, briefly pushing the 10-year yield above 5.3%. Higher real yields generally increase the opportunity cost of holding risk assets, making Treasury instruments relatively more attractive for yield-seeking capital.
At the same time, headlines around Middle East instability and oil price swings have nudged risk sentiment lower. Bitcoin’s correlation with broader risk-on flows means these macro variables can act as headwinds when yields rise and the dollar strengthens.
Federal Reserve commentary has added another layer of uncertainty. Fed officials have signaled that policymakers may require more time to assess incoming data before adjusting rates again. Markets are now fixated on the upcoming U.S. Consumer Price Index report, which could sway expectations ahead of the Fed’s October meeting. A higher-than-expected CPI print would increase the likelihood of persistent rate risk and could weigh on Bitcoin and other risky assets.
Technical view: momentum improving but resistance intact
Daily technicals show Bitcoin trading above key moving averages, which supports a cautiously bullish narrative. BTC sits above its 20-day exponential moving average (EMA) near $83,386 and the 50-day EMA around $80,217. The 100-day and 200-day EMAs remain lower at roughly $76,416 and $75,553, respectively, indicating the medium-term structure has not broken down.
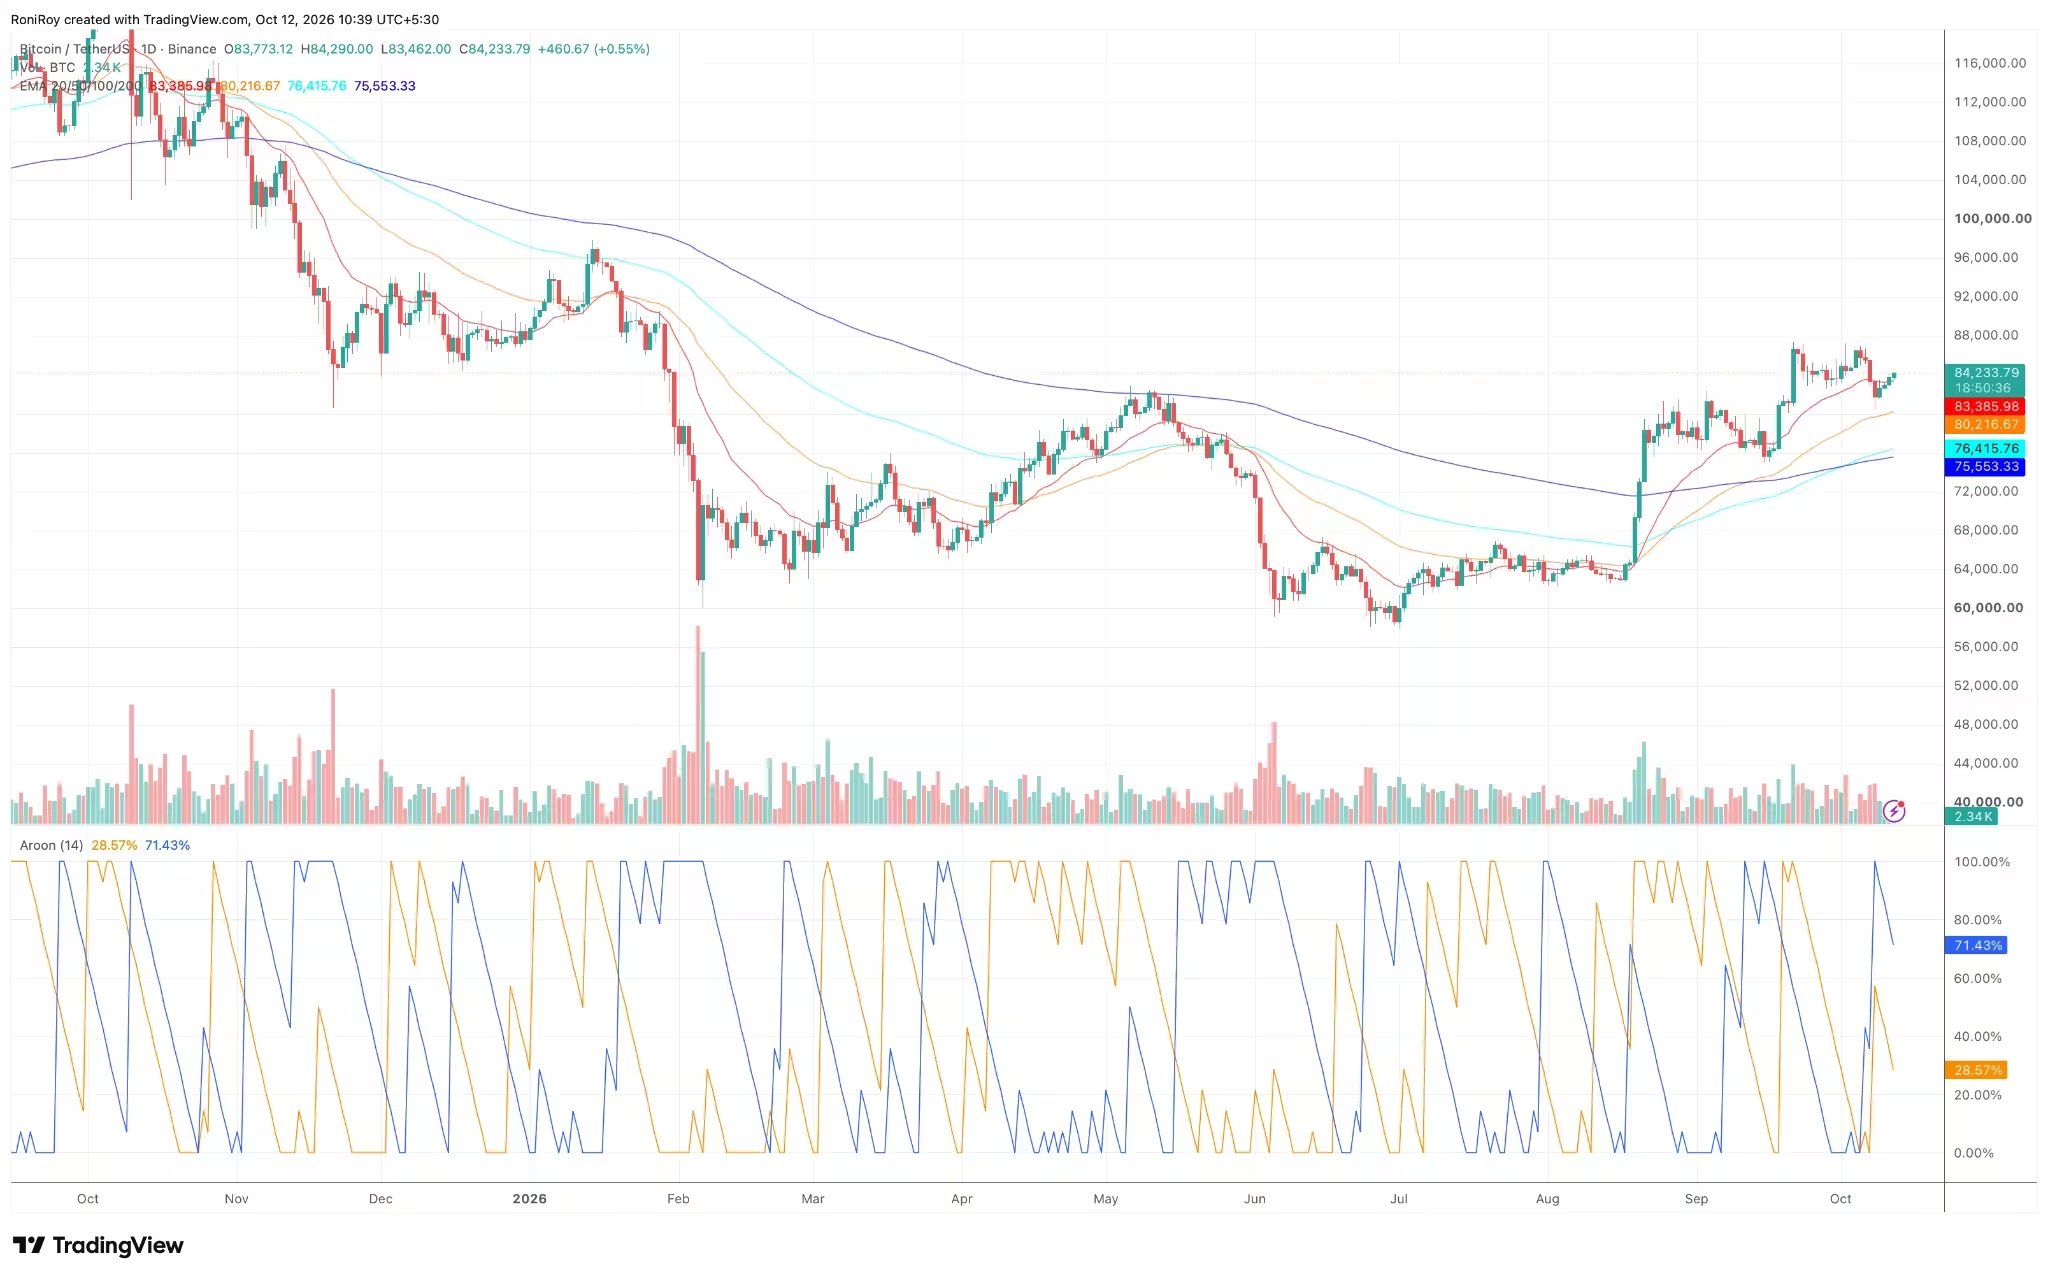
BTC/USDT 1-day price chart.
The arrangement of shorter EMAs above longer ones typically signals a recovery trend, but price needs a solid daily close above $85,000 to validate a fresh bullish leg. A failure to hold the 20-day EMA would open the $82,000 zone as the next meaningful support, while a more significant slide could bring the 50-day EMA and the $80,000 psychological level into play.
Momentum indicators: Aroon, MACD and CMF

The Aroon indicator on a 14-period setting shows Aroon Up at ~71% and Aroon Down at ~29%, suggesting recent highs still carry more weight than recent lows — buyers retain an edge. However, Aroon Up has moderated from higher values, signaling that the pace of upward momentum has slowed since the run-up toward $87,000.
On shorter timeframes the picture has improved. The 4-hour MACD moved into positive territory, with the MACD line crossing above the signal line and a positive histogram that points to growing upward momentum.
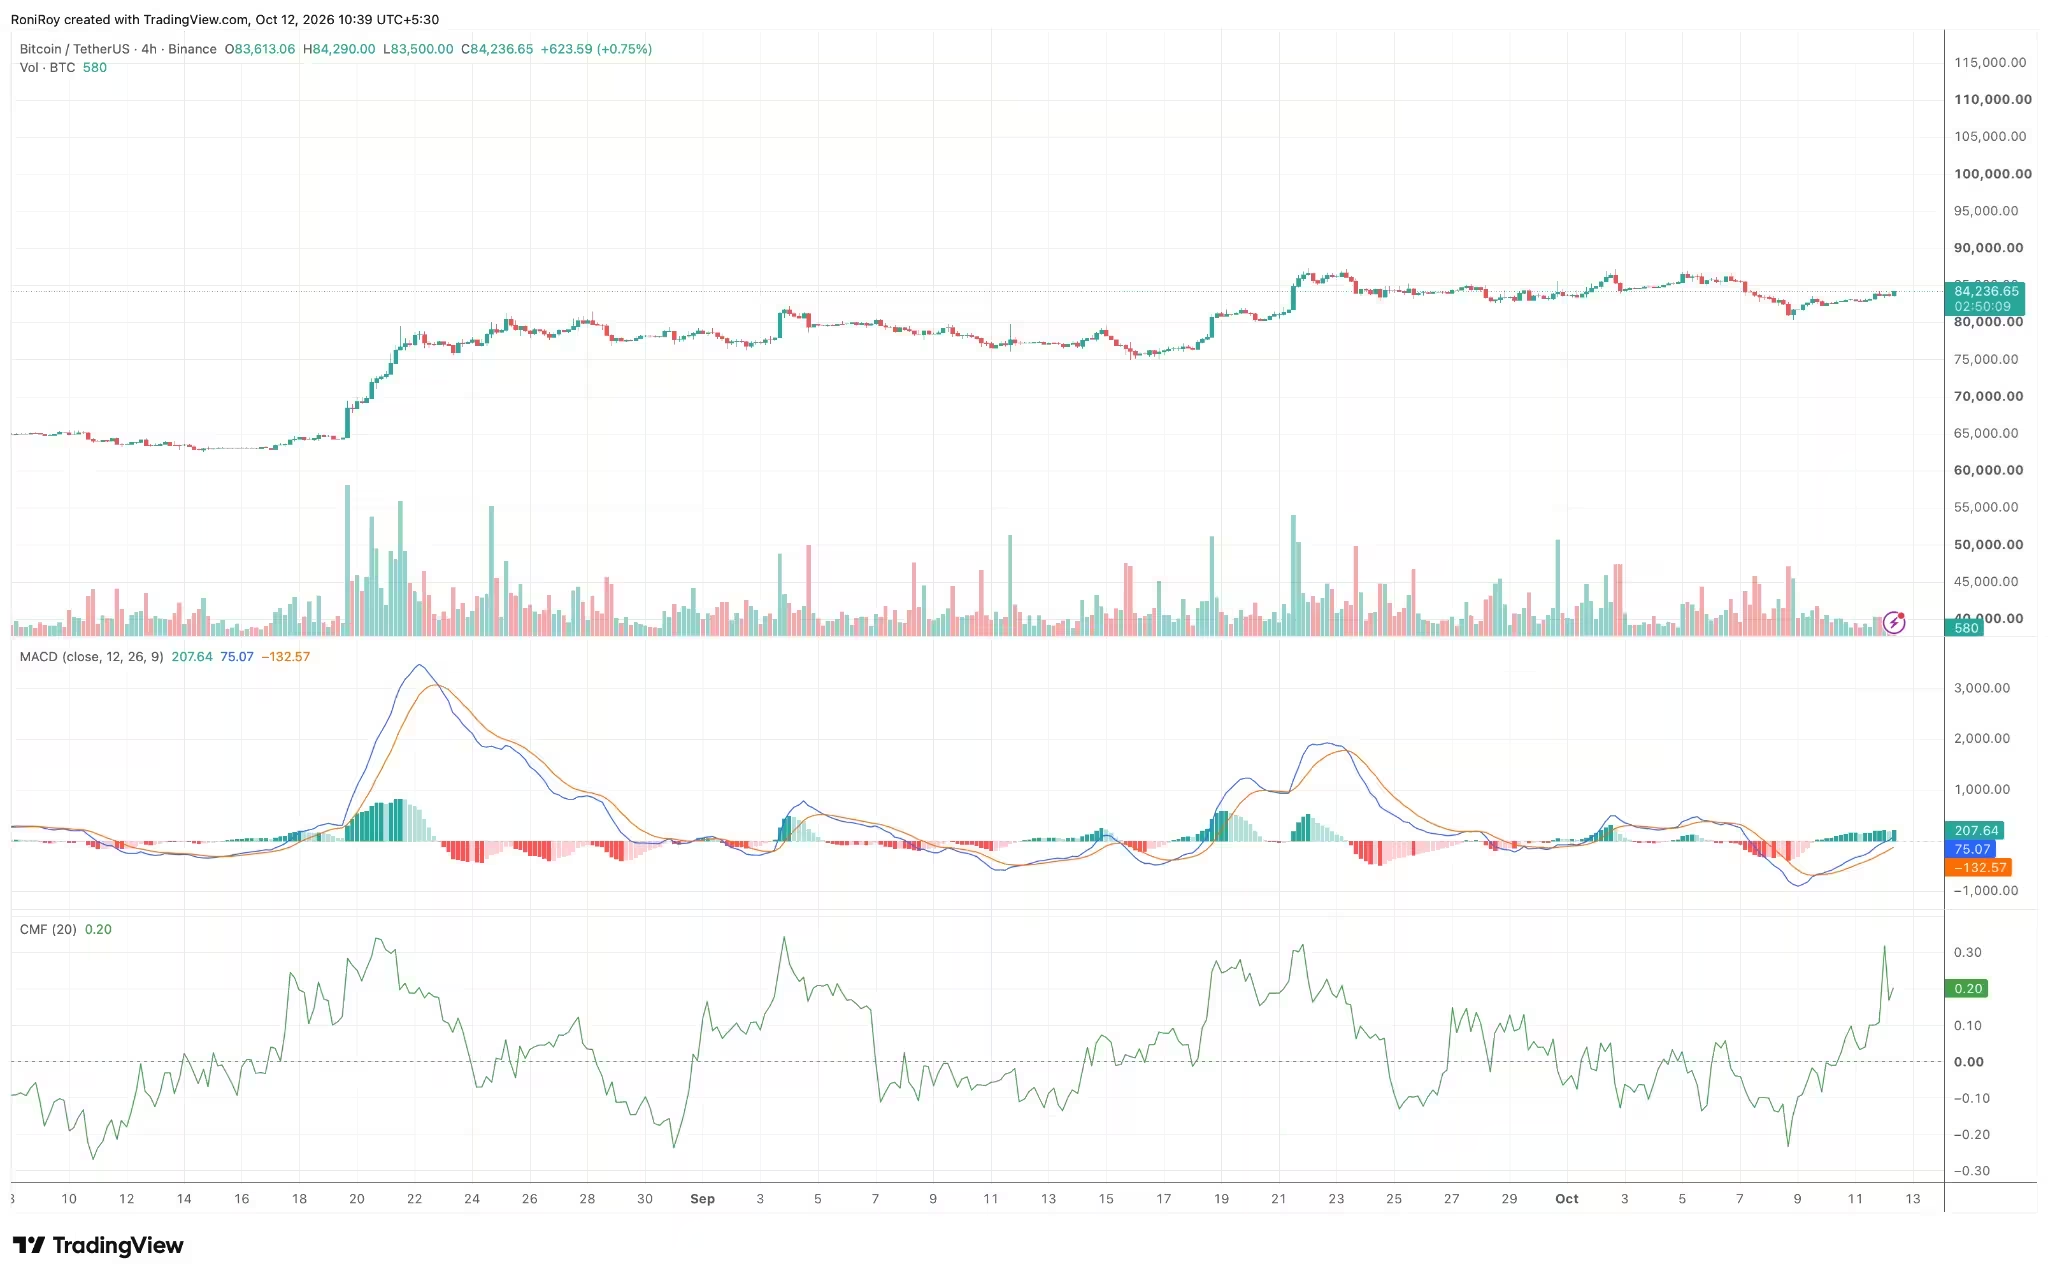
BTC/USDT 4-hour price chart.
Chaikin Money Flow (CMF) on a 20-period basis has bounced back into positive territory (~0.20), indicating that buying pressure is outpacing selling pressure over that window. While CMF has eased from recent peaks near 0.30, its positive reading supports the idea that accumulation is returning at lower levels.
Key price levels and breakout scenarios
Immediate bullish confirmation would require convincing price action above $85,000. A sustained break and daily close above that level could target $86,500 and then the congested $87,000–$87,400 resistance zone, which has repeatedly capped advances. If spot ETF demand picks up materially — analysts have suggested several $340 million-plus ETF sessions would help — BTC could re-attack $90,000.
On the downside, the first technical shield is the 20-day EMA near $83,386. A daily close below that could expose the $82,000 area — a region flagged by several market strategists as a potential liquidation band. Loss of $82,000 could open the door to $80,000, with the 50-day EMA providing layered support around those levels. A more serious correction toward the 100-day EMA near $76,400 would require a broad deterioration in both ETF flows and macro risk appetite.
What traders should watch next
- ETF flows: Monitor net inflows/outflows across U.S. spot Bitcoin ETFs. Sustained inflows are a prerequisite for stronger upside.
- U.S. CPI and Fed commentary: Inflation prints and Fed guidance will influence Treasury yields and the broader risk premium for crypto.
- Treasury yields and dollar strength: Rising yields and a firm dollar can cap BTC’s upside by pulling capital away from risk assets.
- Price action around $85,000: Clear daily closes above or below this level will likely define the next medium-term leg for Bitcoin.
Outlook
Bitcoin’s current range-bound structure reflects an uneasy balance between returning buyers and macro-driven caution. Technical indicators suggest buyers still hold a marginal advantage, but momentum has to accelerate and ETF spot demand must recover for BTC to retest recent highs convincingly.
Absent renewed institutional spot buying or a notable easing in macro pressures, expect volatility to persist around the $84,000–$87,400 zone. Traders and investors should keep a close eye on ETF flows, Treasury yields and the upcoming CPI release — these factors may tip the scales toward either a breakout above $85,000 or a renewed correction toward $82,000–$80,000.


Leave a Comment
Comments
No comments yet. Be the first.