

Cardano slips under $0.25 as momentum fades
Cardano (ADA) traded lower after failing to sustain gains above $0.25, with price action weakening on daily timeframes and analysts flagging further downside targets. The token's pullback has drawn attention to a key demand band in the $0.224–$0.240 area, while liquidation clusters and technical indicators suggest traders should monitor support and resistance closely.
Market snapshot and recent price action
On TradingView, the Binance ADA/USDT daily chart placed Cardano at roughly $0.2434 on Oct. 12, with a session high near $0.2561 and an intraday low close to $0.2411. The decline pushed ADA below the psychologically important $0.25 level after an early-October advance that ran into the rising channel's upper boundary.
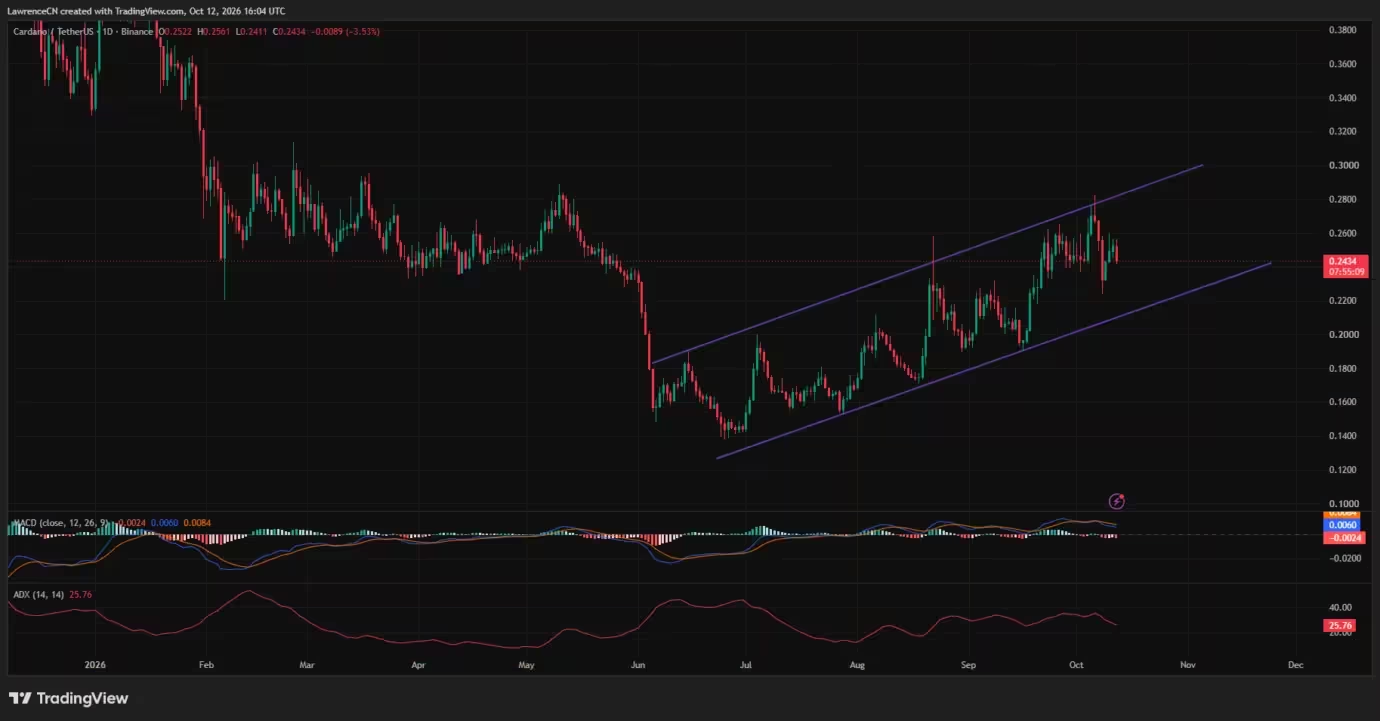
Cardano price daily chart — Oct. 12
The daily structure still shows a recovery that began from about $0.14 in late June, followed by a sequence of higher price swings through August, September and early October. Despite the recent retracement, ADA remains well above that June trough, but the immediate technical question is whether buyers can preserve the rising-channel support after being rejected near $0.27–$0.28.
Key technical signals on the daily chart
Daily momentum readings point to deterioration. The moving average convergence divergence (MACD) histogram turned negative as the MACD line slipped beneath its signal line, signaling that the upward momentum lost steam despite the MACD itself remaining slightly above zero. This combination often precedes deeper consolidation or a steeper correction if support fails to hold.
The average directional index (ADX) on the daily chart stood around 25.76, a level that indicates a moderate trend strength but is lower than recent readings. ADX does not indicate the trend direction, only its vigor, so traders should interpret it alongside momentum and price structure.
Analysts diverge on whether $0.224–$0.240 will hold
Two recent analyst assessments present opposing possibilities for ADA's near-term path. One technical commentator warned that bearish divergence and the formation of a potential lower high increase the risk of further downside. That view highlights multiple retracement targets beneath the recent peak and suggests ADA could continue to unwind gains if selling pressure persists.
By contrast, another analysis framed the $0.224–$0.240 range as a high-conviction demand zone where buyers could step in. That study pointed to the 0.382 Fibonacci retracement level, which sits near $0.2271, as a component of this support area. According to that bullish-but-cautious scenario, a pullback into this zone followed by stabilization could set up another higher low and a renewed attempt toward $0.281.
In the downside case, the same bullish scenario identified lower supports at $0.2105 and the 0.618 Fibonacci near $0.1939, warning that a daily close below ~ $0.19 would materially weaken the recovery thesis. Upside confirmation, meanwhile, would require a decisive daily breakout above $0.281 and a successful retest, which could open targets around $0.3147, $0.3880 and $0.4844 — the latter representing a very large upside projection from recent reference prices but conditional on the support-and-breakout sequence.
Why the $0.224–$0.240 zone matters
This band works as a litmus test for whether the broader recovery remains intact. If buyers defend the area and momentum indicators stabilize or turn bullish, the path toward re-challenging the early-October highs becomes more plausible. If sellers push price through that demand zone, ADA could shift toward lower Fibonacci support levels and invite more aggressive profit-taking.

Weekly context: resistance and averages
On the weekly timeframe, TradingView placed ADA near $0.2435 and below the upper Bollinger Band, which acted as nearby resistance around $0.2688. The weekly 20-period simple moving average, the Bollinger midpoint, sat near $0.1988 and continued to offer a broad structural reference for the ongoing recovery.
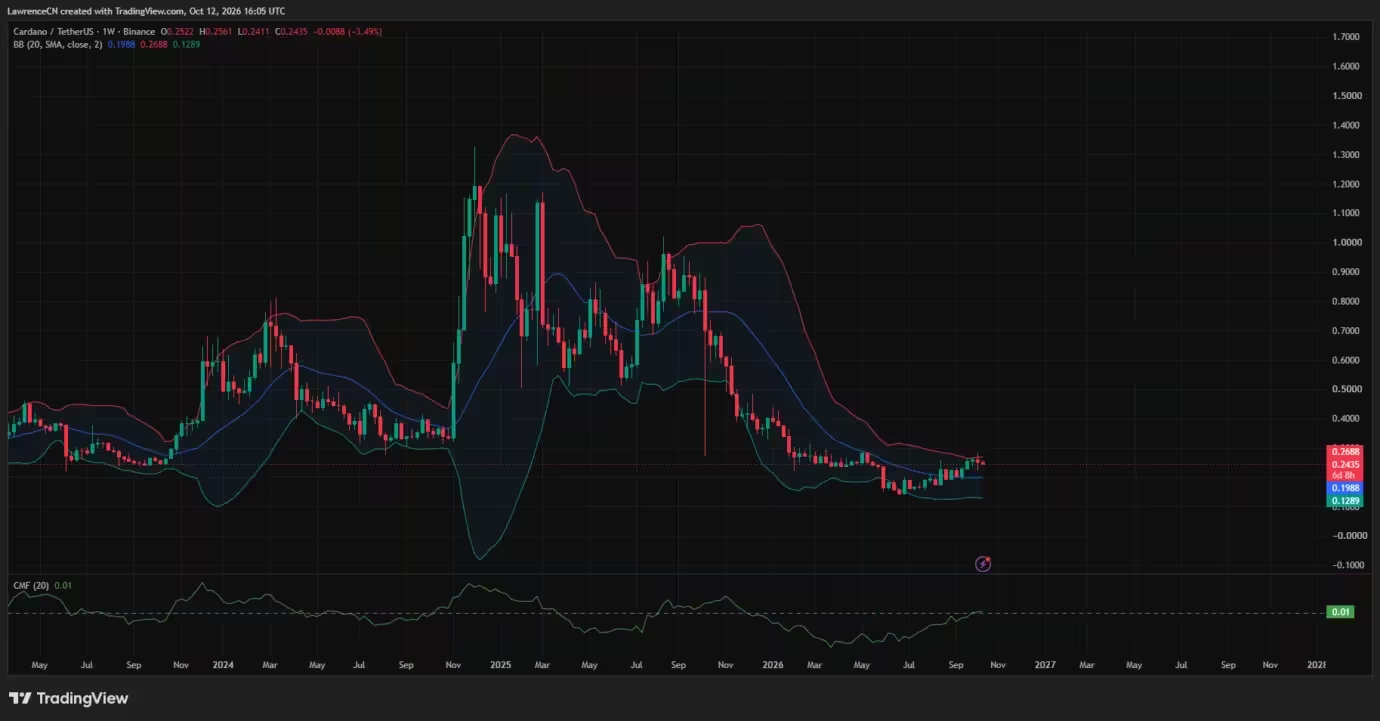
Cardano price weekly chart — Oct. 12
The weekly Chaikin Money Flow (CMF) read just above zero after recovering from negative levels, signaling a modest positive balance between buying and selling pressure on a volume-weighted basis. The weekly picture thus shows that ADA remains above its 20-week average while still some distance from the upper-range levels established during last year's stronger rallies.
Liquidation heatmap highlights overhead pressure
CoinGlass's three-day liquidation heatmap tracked ADA's move from the mid-$0.25 region down toward about $0.243 during the period. The map highlighted several overhead concentrations where leveraged positions could be vulnerable if price attempts to retake those levels.
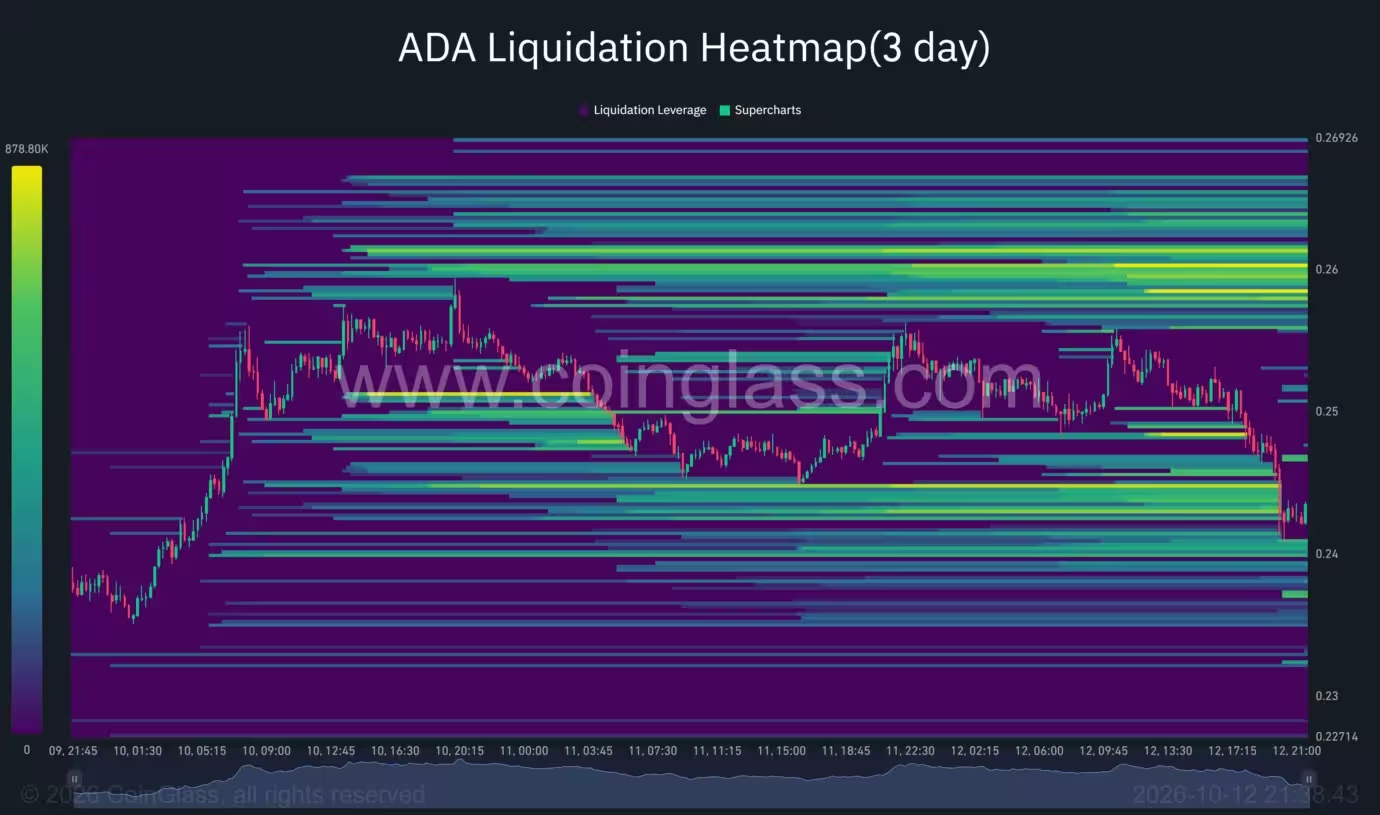
Cardano liquidation heatmap
Notable overhead liquidation bands clustered roughly between $0.258 and $0.262, with extended concentrations toward $0.265–$0.269. Closer bands appeared near $0.244–$0.245 and lower concentrations around $0.240–$0.242. These bands represent estimated liquidation exposure rather than guaranteed forced selling; they help traders anticipate potential volatility if price approaches those price levels.
What traders and investors should watch
Short-term traders should monitor intraday reactions around $0.24 and $0.25, as Binance USDT pricing places those levels as immediate reference points for U.S. dollar value. Watch the MACD histogram for confirmation that bearish momentum is easing, and the ADX for any resurgence in trend strength.
Swing traders and investors should focus on the $0.224–$0.240 demand zone as a pivotal area that will likely determine whether ADA resumes its rising-channel advance or shifts into a deeper correction toward the $0.1939–$0.2105 region. A weekly close below the 20-week moving average would add weight to bearish scenarios, while a confirmed daily breakout above $0.281 with a retest would strengthen the bullish case.
Risk management and positioning
Given the liquidation clusters above and the mix of technical signals, risk management remains essential. Traders using leverage should size positions conservatively and set clear stop-loss levels below identified support bands. Long-term holders tracking Cardano’s fundamentals should consider the broader market context, on-chain developments, and upcoming protocol or ecosystem updates that could influence demand for ADA.
Bottom line

Cardano’s retreat under $0.25 reflects fading daily momentum and presents a decisive test of the $0.224–$0.240 support zone. Analysts remain divided: some see a further retracement forming lower highs, while others expect the demand zone to hold and pave the way for another leg up if buyers step in. Traders should watch technical indicators — MACD, ADX, Bollinger Bands and Fibonacci retracement levels — and heed liquidation heatmaps to manage exposure as ADA navigates this critical range.

Leave a Comment
Comments (2)
Feels a bit overhyped. MACD turning, ADX slipping, but still above June trough so don't freak out yet. Weekly close below 20w MA and then it's messy
Is that $0.224-$0.240 demand band really gonna hold tho? Liquidation clusters overhead smell like bigger chop, if sellers push thru, could get ugly...