

Pi Network nears $0.08 as bearish momentum builds
Pi Network's PI token has resumed a downward drift, testing the psychologically important 8 cents mark as traders weigh the odds of further losses. Data from TradingView showed PI trading near 0.08006 USDT on OKX during the October 12 session, with intraday activity marked by a high of 0.08273 and a low of 0.07950. Despite a modest bounce off the session low, the token remained below its daily open, signaling persistent selling pressure across multiple timeframes.
Price action and short-term levels to watch
Daily charts indicate a recent decline of roughly 2.96 percent at the cited TradingView price, while CoinGecko recorded steeper losses over broader horizons: about an 8 percent drop over seven days and roughly 16.4 percent in the past month. By comparison, the wider cryptocurrency market retraced approximately 4.7 percent during the same weekly window, leaving PI notably weaker than many peers.
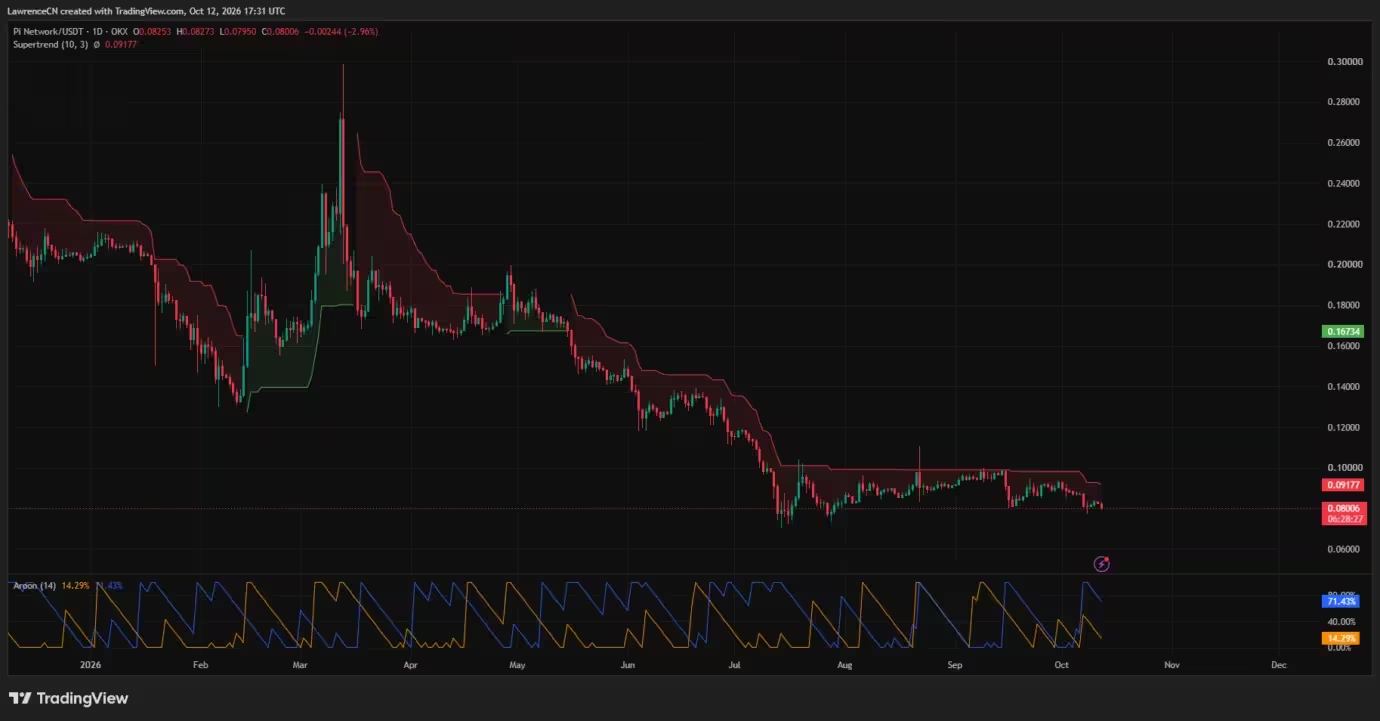
Pi Network price daily chart — Oct. 12
Key short-term references for traders are concentrated around the 0.08 area. The most immediate support is the session low at 0.07950; a decisive break below this price would open the door to a continuation of the downtrend and increase the likelihood of revisiting earlier July activity zones near 0.075. CoinGecko lists PI's all-time low at 0.07059, a level that currently sits about 13.3 percent beneath the current price and underscores the token's distance from its historical peaks.
On the upside, the first observable floor for any recovery is the lower 4-hour Bollinger Band, followed by the Bollinger midpoint around 0.08204 and the upper band near 0.08367. Above those short-term boundaries, daily resistance clusters around 0.09 and the Supertrend level, which has acted as a persistent ceiling during recent selling waves.
Immediate support and resistance
- Immediate support: 0.07950 (session low)
- Near-term support: 0.075 (July trading activity)
- First resistance cluster: 0.08041 (4-hour lower Bollinger Band) and 0.08204 (Bollinger midpoint)
- Key resistance: 0.09177 (daily Supertrend) and the 0.10 region where prior rebounds stalled
Technical indicators point to sustained bearish bias
Multiple technical signals continue to favor the downside. TradingView's daily Supertrend indicator remains above the market at 0.09177, producing a sustained bearish reading that has held through the recent episodes of buying. For PI to flip the daily structure bullish, it would need to rally roughly 14.6 percent from the cited price to clear the Supertrend, and clear the 0.083 area first.

The daily Aroon oscillator reinforces the weak backdrop. Aroon Down sits near 71.43 percent while Aroon Up measures about 14.29 percent, a large spread that reflects a very recent low without a corresponding new high in the indicator lookback period. In practice, this means momentum has favored sellers for an extended window.
Bollinger Bands and intraday momentum
On the 4-hour chart, PI traded below the lower Bollinger Band, with the lower band anchored at 0.08041, the midpoint at 0.08204 and the upper band at 0.08367. At 0.08006, the token was trading slightly under the lower band, indicating price had extended outside its recent volatility envelope. A close or sustained move back above the lower band would be the first step toward normalization, but the midpoint and upper band would present successive hurdles.
The short-term Bull Bear Power reading was negative, with the histogram below zero, signaling that sellers are still controlling intraday momentum. Taken together, these indicators suggest that any rebound will likely face layered resistance rather than one clear pivot point.
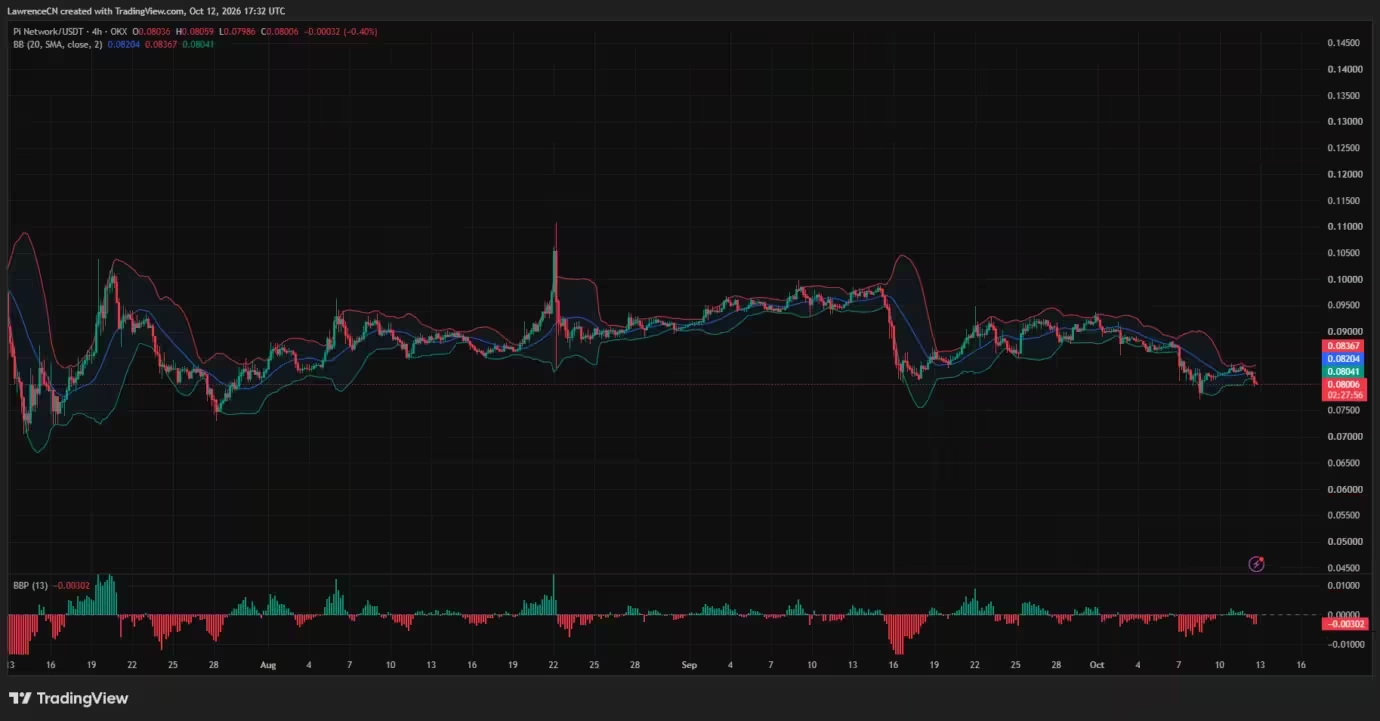
Pi Network price 4-hour chart — Oct. 12
Market activity and derivatives context
Market participants have not been sitting on the sidelines. CoinGecko reported a 24-hour trading volume of around 4.46 million USDT for PI, representing a 53.5 percent increase from the previous day even as price fell. Higher volume on down moves can indicate conviction among sellers or short-covering that coincides with liquidation events.
Derivative metrics add further nuance. An industry market note cited CoinAnk figures showing futures open interest for PI dropping from $10.52 million to $8.86 million week over week, a decrease of roughly 15.8 percent. Lower open interest can reflect flattened speculative exposure or positions being closed as traders reassess near-term risk.
Project fundamentals and roadmap reminders

Beyond technicals, PI retains a visible narrative. CoinGecko lists the project's founders as Nicolas Kokkalis and Chengdiao Fan, both with doctoral backgrounds at Stanford, and names SocialChain Inc. as the organization managing the network. The team has scheduled the Open Network transition for February 20, 2025, a milestone intended to enable external integrations and further mainnet activity. User verification and mainnet migration work is expected to continue beyond that date, which keeps the development timeline relevant for medium-term holders.
Market capitalization and supply dynamics also shape perceptions. At the referenced snapshot, CoinGecko placed PI's market cap near $899 million with approximately 11.24 billion tokens in circulation. These figures help frame how price moves translate into valuation shifts and liquidity dynamics across exchanges.
Scenarios that could stop the slide
Several outcomes could arrest or reverse the decline:
- A clean reclaim of the 4-hour Bollinger midpoint around 0.08204 would be the first technical sign that sellers are losing short-term control.
- Sustained buying that pushes PI back above 0.08367 and toward 0.09 would challenge the dominant Supertrend and increase the odds of a stronger recovery.
- Positive project news, exchange listings, or partnerships that expand liquidity or reinforce user growth could attract fresh demand and shift sentiment.
- A broader market rebound led by large-cap cryptocurrencies could lift PI as risk appetite returns, narrowing its underperformance versus the crypto market.
Conversely, factors that would likely intensify selling include a decisive breakdown below the 0.07950 session low, further deterioration in derivatives open interest driven by deleveraging, or negative project developments that sap community confidence.
Risk management and trading outlook
For traders, risk controls remain essential given PI's volatility and the layered resistance above current levels. Short-term scalpers may watch for re-entry inside the Bollinger bands as the first signal to consider long positions, while swing traders should require confirmation above the midpoint and preferably a daily close above the Supertrend to reduce the odds of a false breakout.
Longer-term investors should balance project milestones—like the Open Network launch and ongoing mainnet migration—with technical context and overall crypto market cycles. Position sizing and stop placement should reflect the potential for rapid moves in either direction.
Conclusion

Pi Network is testing the 0.08 area under a clear bearish bias across daily and intraday indicators. While support around the session low and July trading activity exists, PI needs to recover the 4-hour Bollinger zone, then the daily Supertrend, to signal a sustainable reversal. Market participants will likely closely watch trading volume, derivatives open interest, and project developments as catalysts that could either halt the slide or accelerate it toward lower historical references. For now, layered resistance and negative momentum suggest caution until the chart shows convincing signs of recovery.

Leave a Comment
Comments (1)
Wait, how legit is that volume spike tho? Higher vol on down days screams sell pressure or wash trading. Hard to trust until open interest steadies, imo