

Ethereum hits resistance as recovery stalls near $2,560–$2,575
Ethereum has staged a rebound from last week s sell-off but now confronts a decisive resistance zone just above current levels. After dipping to roughly $2,410 during the recent pullback, ETH recovered toward $2,530, yet buying pressure fades as multiple technical barriers line up between $2,558 and $2,640. Market participants are watching whether a breakout above the $2,575 area can catalyze a fresh upward leg toward $2,700 and beyond.
Quick market snapshot
- ETH price trading near $2,530, below both the daily 20-day and 50-day moving averages.
- US spot Ethereum ETFs recorded $542.2 million in net outflows during Oct. 5–9, according to Farside Investors.
- Analysts identify a tight recovery band around $2,560–$2,575 as the key next test for bulls.
- Liquidation concentration from CoinGlass highlights overhead clusters near $2,585, $2,635–$2,640, and $2,740.
Why the $2,560–$2,575 zone matters
On the daily chart the 50-day simple moving average sits at about $2,558 and the 20-day moving average at roughly $2,640. These two commonly watched moving averages create a narrow but significant resistance corridor. Ethereum briefly pierced into that band and recorded a session high around $2,579.88 before slipping back toward the $2,530 area, leaving the recovery attempt inconclusive.
Longer-term moving averages remain well below current trading levels, with the 100-day at approximately $2,240 and the 200-day near $2,137. That suggests the medium-to-long-term trend is still higher than these averages, but in the short term ETH must negotiate the nearer resistance cluster first.
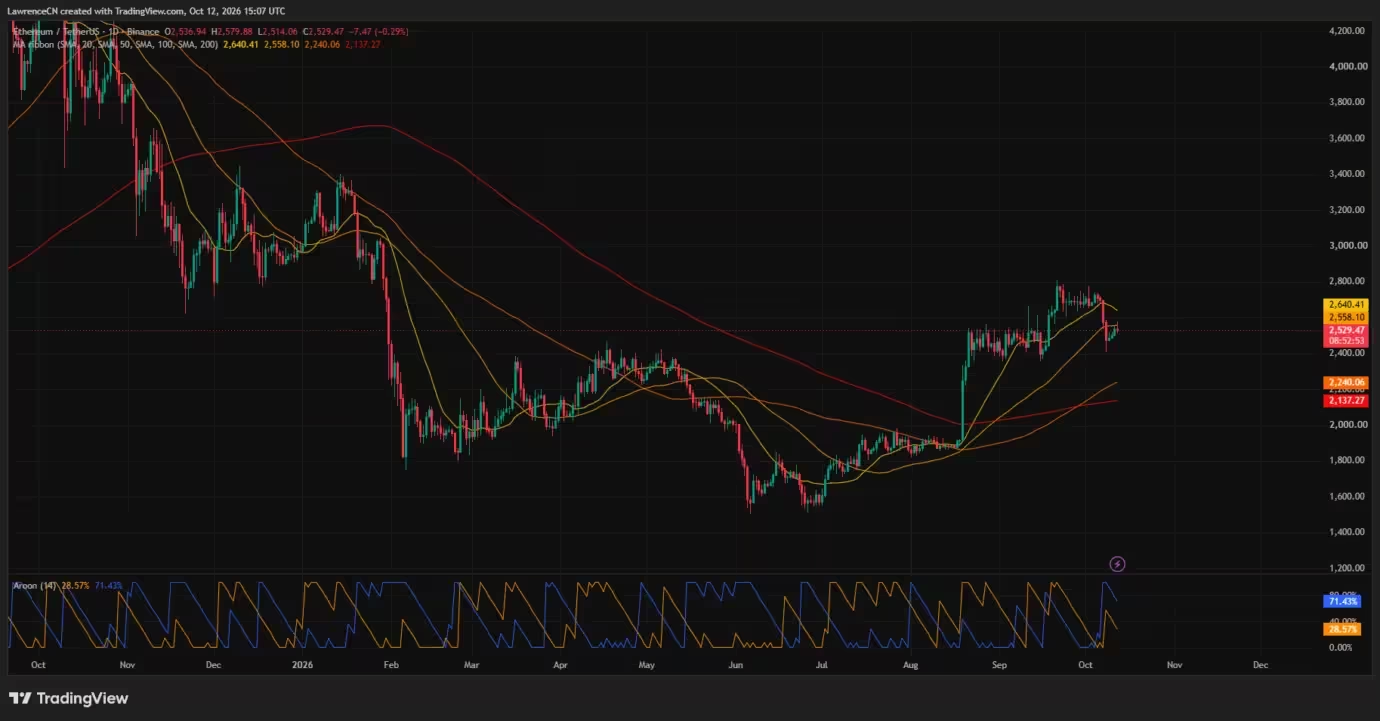
Ethereum price daily chart — Oct. 12
Technical indicators reflect the same tension. The Aroon indicator s down line registered a stronger reading than the up line, signaling the recent dominance of lows in the lookback window despite the bounce from the sell-off. Until price sustains a move above the 50-day average and then the 20-day average, traders should expect choppy action.
Shorter timeframe: 4-hour structure and momentum

Trading on the 4-hour chart shows Ethereum near $2,526 and above the Bollinger Bands middle line, with the upper band close to $2,560. That places the 4-hour upper band and the daily 50-day average in near alignment, reinforcing the $2,558–$2,560 region as a near-term hurdle.
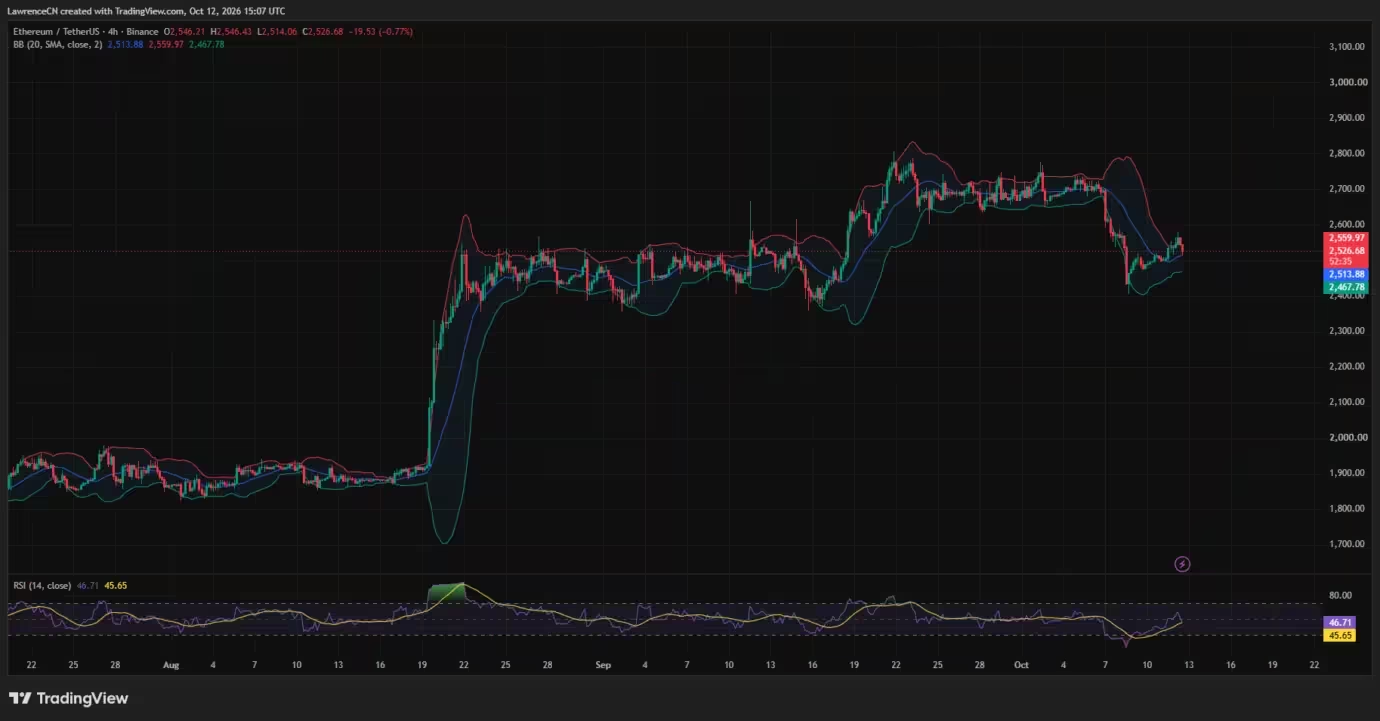
Ethereum price 4-hour chart — Oct. 12
The 4-hour RSI recovered from oversold levels but remains under the neutral 50 mark, implying momentum favors neither clear bulls nor bears. Price action on this timeframe described a recovery from about $2,410, consolidation around $2,480–$2,510, then an advance toward $2,570 before a pullback. Support references include the Bollinger middle line near $2,514, the psychological $2,500 mark, and the lower band around $2,468. A deeper slide would refocus attention on the recent low near $2,410 and the $2,400 area.
Analyst thresholds and what they imply
Several analysts have flagged nearly identical thresholds for confirmation of a bullish resumption. Ted Pillows identified $2,560–$2,570 as the immediate recovery zone, writing that reclaiming that range could open the path to $2,700. Michaël van de Poppe set a slightly higher conditional level, stating he wants to see a convincing breakout above $2,575 before upgrading his outlook. Both views place the decisive test in the narrow band above current prices.
Van de Poppe also suggested that if Ethereum breaks higher it could outperform Bitcoin in the coming period, though he explicitly conditioned that expectation on stronger price action and a breakout through key resistances.
ETF flows and liquidation clusters add pressure
Fund flows into US spot Ethereum ETFs have become a headwind in recent days. Farside Investors reported $542.2 million in net outflows from Oct. 5–9, adding to a run of negative sessions that totaled $697.4 million across nine straight days from Sep. 29 through Oct. 9. The largest single outflow last week came on Oct. 6 when BlackRock s ETHA lost $201.9 million, followed by additional withdrawals on Oct. 7 8 and 9.

CoinGlass s liquidation heatmap shows multiple concentrated bands of potential stop-loss and liquidation orders above the market. Prominent clusters sit near $2,585, $2,635–$2,640, and around $2,740, with nearer downside bands around $2,480, $2,450–$2,470, and $2,400. The nearest overhead cluster lies just above the analysts documented $2,560–$2,575 recovery zone, which could act as a magnet for short-covering but also create volatility when price first engages those levels.
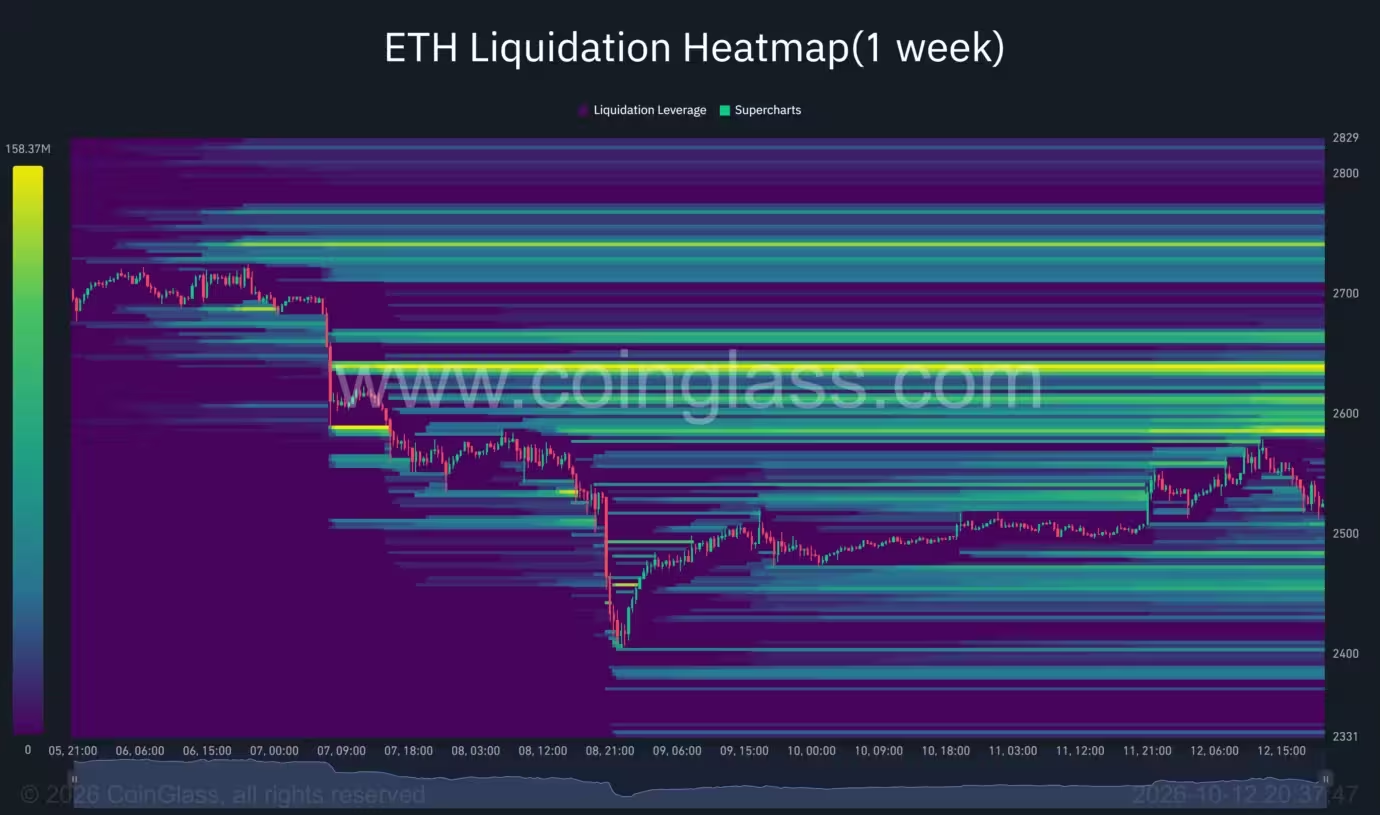
Ethereum liquidation heatmap
These liquidation concentrations are important for risk-aware traders because they tend to amplify moves when price runs into them. A push above $2,575 could trigger cascades of short squeezes and liquidations, accelerating a rally toward the $2,700 region; conversely, failure to clear the heatmap bands may reinforce selling and drive ETH back toward support.
Where support and resistance sit next
Immediate resistance: $2,558 (50-day SMA) to $2,575, then the 20-day SMA near $2,640.
Immediate support: $2,514 (Bollinger mid), psychological $2,500, then $2,480 and the recent low near $2,410.
A sustained recovery above the 50-day average and then above $2,575 would be the clearest technical signal for a renewed bullish phase, targeting $2,700 and potentially the September high near $2,800. If ETH cannot hold the $2,500 area, downside risk grows and traders will watch the lower moving averages and prior low for buying interest.
What traders and investors should watch
- Price action at $2,560–$2,575: A convincing daily close above this zone would increase the odds of a rally.
- ETF flows: Continued outflows from US spot Ethereum ETFs could sap momentum; renewed inflows would help support higher prices.
- Liquidation heatmap levels: Overhead liquidation bands may fuel volatility on breakouts or rejections.
- Momentum indicators: RSI and Bollinger Band position on the 4-hour and daily charts will signal whether momentum is returning or erosion continues.

For investors and traders focused on ETH price, the coming sessions are likely to be a tactical test of whether buyers can overcome clustered resistance and rebuild conviction. A breakout through $2,575 would be the clearest path toward reclaiming $2,700, whereas failure to do so would keep Ethereum range-bound between near-term support at $2,500 and the resistance band above.
Market participants should combine technical signals with flow data from ETFs and order-book or liquidation heatmaps to manage risk around potential whipsaws. The alignment of moving averages, Bollinger Bands, and liquidation clusters in the $2,558–$2,640 area makes this a critical juncture for ETH s short-term direction.

Leave a Comment
Comments
No comments yet. Be the first.