
7 Minutes
Ethereum slips under $4,000 amid ETF outflows and macro pressure
Under pressure from sustained exchange traded fund withdrawals and broader macroeconomic headwinds, Ethereum dropped beneath the $4,000 threshold for the first time since early August. The selloff has pushed short-term momentum into bearish territory even as on-chain data shows large investors accumulating sizable amounts of ETH.
Key takeaways
- ETH price declined below $4,000, trading around $3,988 at the time of reporting, down roughly 4% on the day.
- U.S. spot Ethereum ETFs posted a combined net outflow of $79.4 million on Sept. 24, marking a third consecutive day of withdrawals.
- Whales and institutional desks moved large volumes of ETH into private wallets, with 210,452 ETH—about $863 million—transferred in a concentrated six hour window.
- Derivatives data showed rising volume and a slight uptick in open interest, signaling increased speculative activity and hedging.
Price action and market context
Ethereum has retraced from late August highs and is now roughly 19% below its all time high of $4,946 recorded on Aug. 24. Over the past week ETH has lost about 13%, and monthly losses sit near 10%. The recent decline triggered more than $170 million worth of long liquidations, underscoring how leveraged positioning amplified downside movements.
Trading activity, however, did not evaporate during the drop. Daily on chain and exchange metrics point to an active market: Ethereum daily volume climbed to $35.2 billion, up more than 13% from the previous session. In derivatives markets, CoinGlass data shows ETH futures volume increased 11.6% to $86.9 billion, while open interest rose a modest 1.0% to $57.7 billion. The combination of higher volume and slightly higher open interest typically reflects short-term speculative positioning and hedging against further volatility.
Spot ETH ETF outflows and their influence
Flows into and out of regulated products have become an important driver of short term price dynamics for Ethereum. According to SoSoValue, U.S. spot Ethereum ETFs experienced a combined net outflow of $79.4 million on Sept. 24. This marked the third consecutive day of withdrawals and contributed to downward pressure on the market.
Fidelity's FETH was the largest single redemptions source with $33.3 million of outflows, followed by BlackRock's ETHA with $26.5 million. Other issuers including Grayscale, ARK 21Shares, and Bitwise also saw notable redemptions. While ETF flows alone rarely explain the full price move, their cumulative impact during periods of thinner liquidity or risk-off sentiment can amplify downside moves.
The pullback also reflects the wider macro backdrop. After the Federal Reserve reduced rates by 25 basis points to a 4.00–4.25% range earlier in September, ETH briefly rallied above $4,600. That rally faded as traders took profits and digested softer labor market data, a pattern reminiscent of rallies that retraced around prior policy events.
On-chain activity: whales accumulate
Even as prices fell, on-chain analytics signaled renewed interest from larger market participants. A post on X from Lookonchain reported concentrated transfers involving several institutional desks and exchanges that funneled a large quantity of ETH into a set of wallets.
According to the report, ten wallets received about 210,452 ETH, valued at roughly $862.9 million, in a six hour window. Transfers originated from a mix of exchange hot wallets and over the counter (OTC) desks such as Kraken, Galaxy Digital, BitGo, and FalconX. Large accumulations by whales are commonly interpreted as a sign of longer term conviction, and such moves can presage recoveries if selling pressure abates.
Why whale moves matter
Whale accumulation can reduce available sell-side liquidity on exchanges and indicate that sophisticated players are positioning for a multi-week or multi-month horizon. That said, large off-exchange transfers do not always translate immediately into price support; timing and subsequent behavior of those wallets are key.
Derivatives, liquidity and short-term positioning
The derivatives landscape shows traders repositioning for elevated near-term volatility. With futures volume climbing and open interest edging higher, market participants appear to be increasing hedges and taking directional bets. A modest rise in open interest accompanied by higher volume typically indicates new positions are being opened rather than just existing positions being closed.
Meanwhile, the market saw notable long liquidations which contributed to sharp intraday moves. Leveraged traders should watch funding rates and liquidation metrics, as these can trigger quick feedback loops in both directions during turbulent sessions.
Technical outlook for Ethereum
From a technical analysis perspective, Ethereum has shifted to a more cautious posture. Price recently fell below the Bollinger Bands midline around $4,408, and the lower band near $3,750 has emerged as an immediate focus for buyers. Momentum indicators are weakened: the relative strength index (RSI) sits near 34.5 and is approaching oversold readings, which could create a window for a technical bounce.
Key moving averages are presently overhead resistances. The 10-, 20-, and 50-day moving averages all lie above current levels, reinforcing short-term bearish pressure, while the 200-day exponential moving average around $3,392 offers deeper support in the event of an extended selloff. The MACD remains negative, validating the current bearish tilt, while nearer-term support appears to be forming close to the 100-day EMA at approximately $3,850.
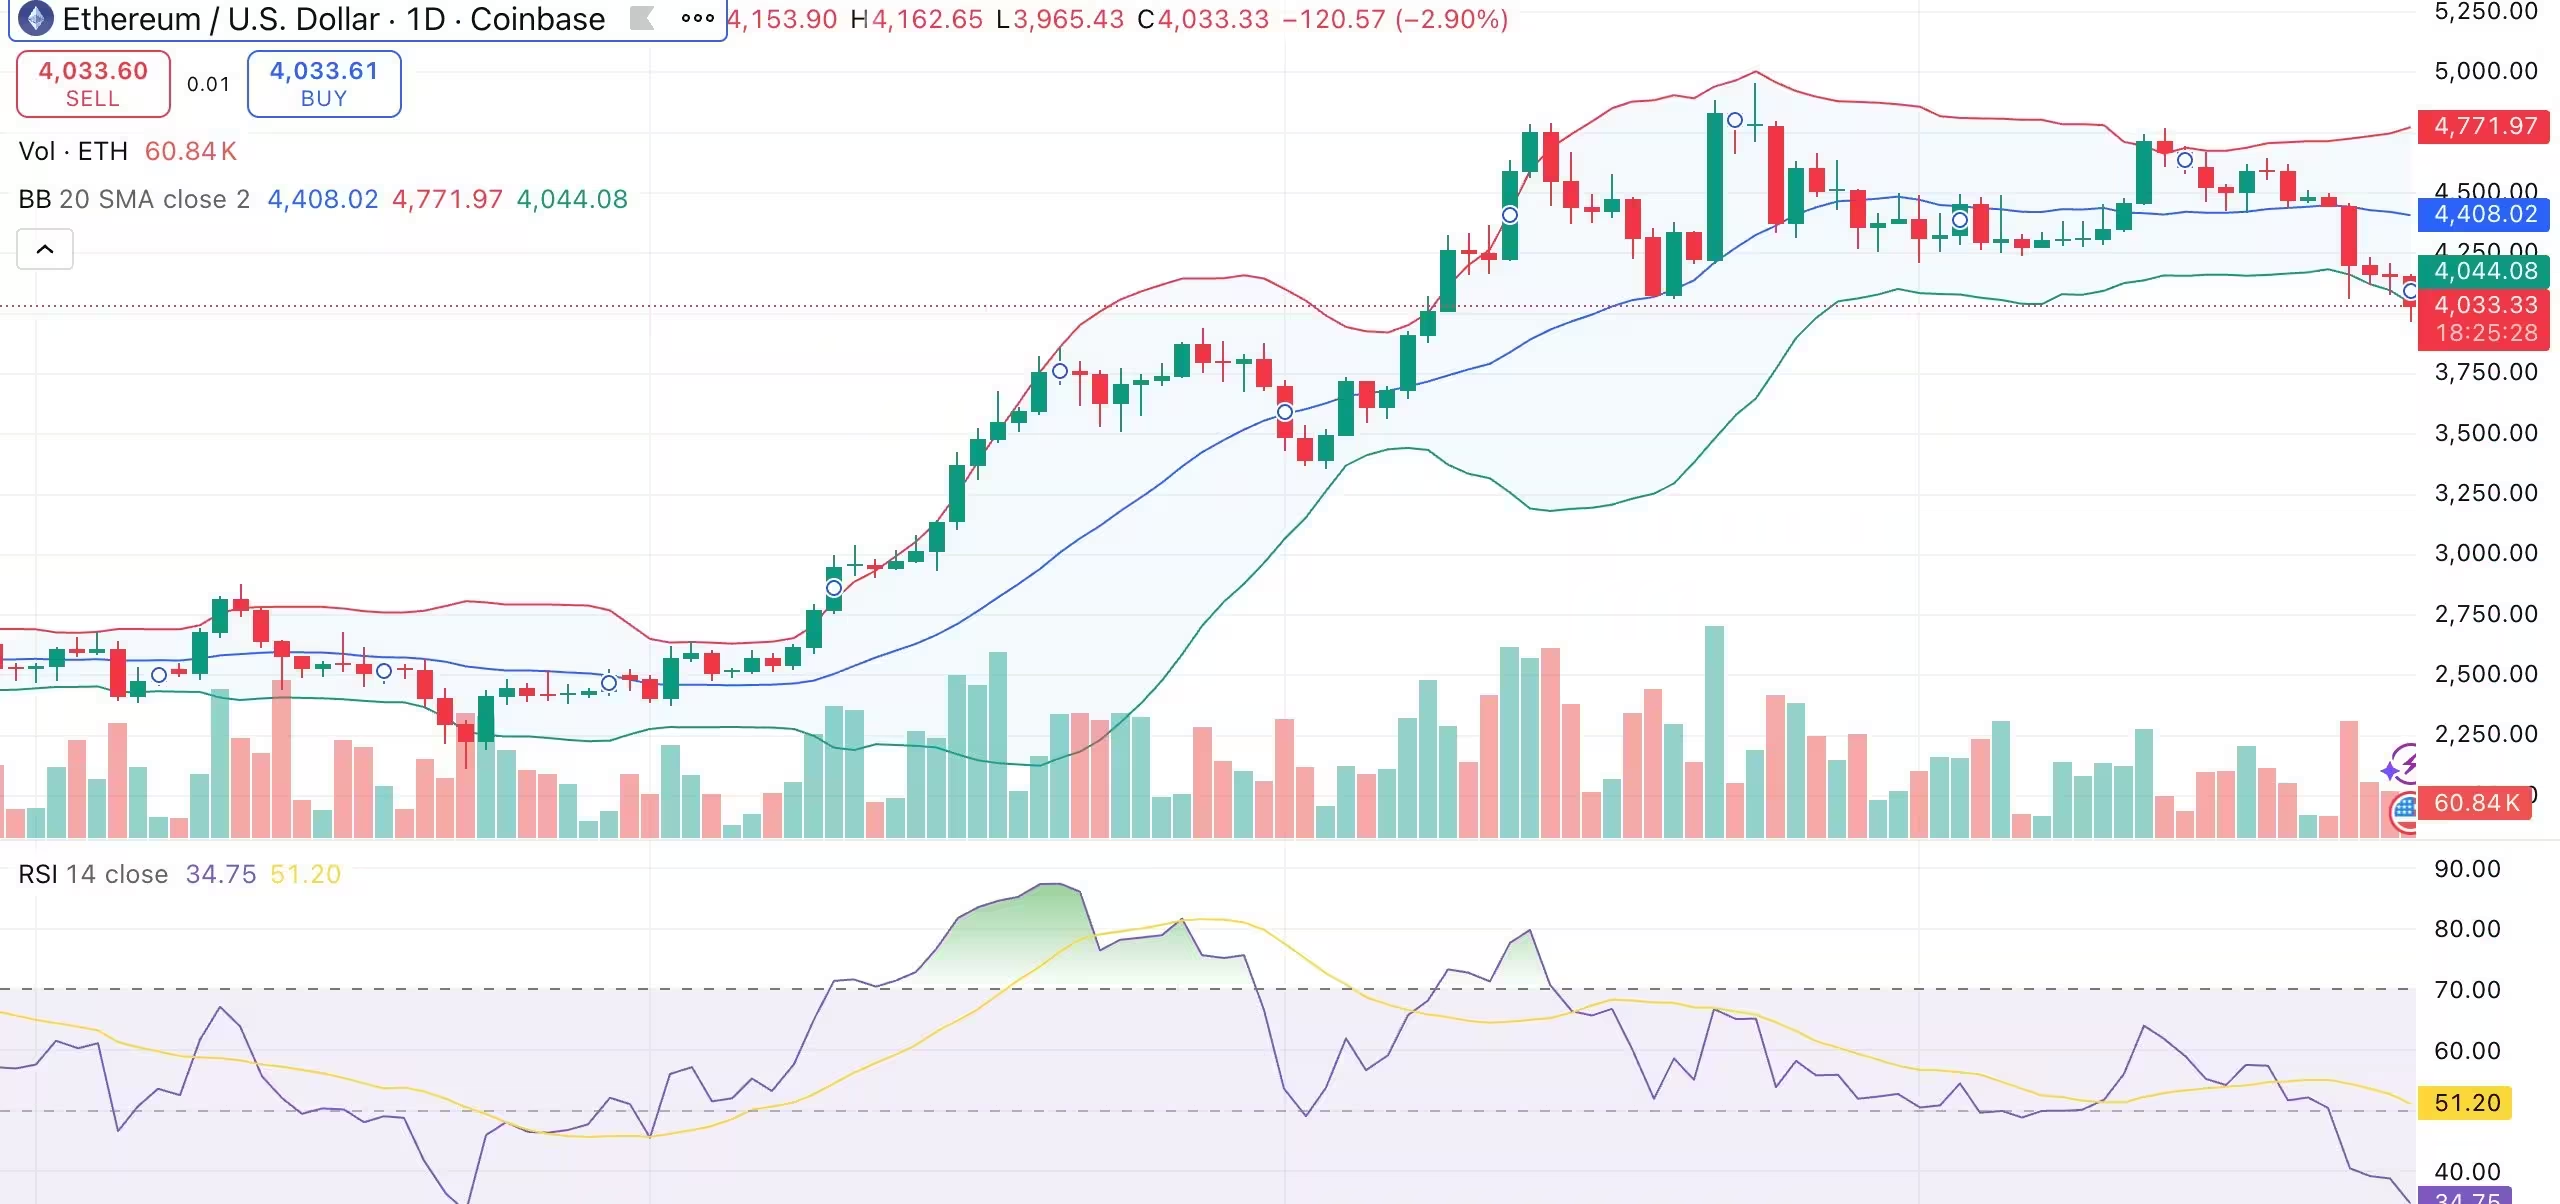
Ethereum daily chart
For bulls to regain control, reclaiming the $4,250–$4,400 band and holding above it with volume would be an important step. Continued ETF outflows or deteriorating macro conditions could push ETH toward the $3,850 zone or potentially lower, where longer-term moving averages may attract buying interest.
Outlook and what traders should watch
- ETF flows: Monitor daily inflows and outflows across major U.S. spot ETH ETFs. Sustained redemptions could keep selling pressure elevated.
- On-chain whale activity: Watch large transfers and wallet behavior for signs of accumulation or redistribution.
- Macro signals: Rate announcements, employment reports, and risk sentiment often influence crypto flows and can trigger quick repricing.
- Derivatives metrics: Funding rates, open interest, and liquidation events can accelerate moves and are critical for short-term traders.
- Technical levels: Important ranges include $4,250–$4,400 for a bullish recovery, $3,850 as near-term support, and the 200-day EMA near $3,392 as a deeper cushion.
Conclusion
Ethereum's dip beneath $4,000 reflects a mix of ETF outflows, profit-taking after a recent Fed-driven rally, and broader market risk-off tendencies. Still, elevated trading volumes and concentrated whale buying show that institutional and large investors remain active. For traders and investors, watching ETF flows, on-chain accumulation, derivatives positioning, and macro developments will be essential to gauge whether this pullback is a brief correction or the start of a more extended consolidation phase.
Source: crypto
Leave a Comment