
7 Minutes
Flare (FLR) posts strong breakout after FXRP launch
Flare Network's native token FLR has shown renewed momentum after a decisive move that technical traders interpret as bullish. The token surged to an eight month high and is now attracting higher trading and derivatives volumes, an uptick in futures open interest, and a clear bullish simple moving average crossover on the daily chart. These developments, combined with growing social sentiment following the launch of the network's FAssets product FXRP, have traders and DeFi participants closely watching for a potential continuation toward the next resistance zone.
Key highlights at a glance
- FLR reached an 8 month high of $0.028 on Sep. 24 and had settled near $0.026 at the time of reporting. The price is roughly 30% above its monthly low and about 136% above the lowest value recorded this year.
- Daily trading volume spiked by more than 350% over the latest 24 hour window, reflecting a strong increase in market participation.
- Derivatives volumes rose roughly 335% to about $15.8 million, according to CoinGlass data.
- Futures open interest climbed 23.8%, suggesting fresh liquidity is entering the market to support the upside move.
- FLR's long to short ratio sits above 2.4 across major time frames, signaling a dominant bullish bias among leveraged traders.
Why FXRP matters: expanding DeFi uses for XRP
A major catalyst behind FLR's recent lift is the debut of FXRP, the first live asset issued by Flare's FAssets protocol. FXRP is a wrapped representation of XRP minted on Flare, enabling XRP holders to deploy their tokens across decentralized finance protocols built on Flare. This interoperability instantly increases potential utility for both XRP and FLR, as wrapped assets drive onchain activity, liquidity provisioning, and fee revenue for host networks.
Community dynamics also play into the story. Santiment and other sentiment trackers show improved social engagement for Flare since the FXRP release. The XRP community is known for its active support of projects that extend the asset's usability, and the FXRP launch appears to have drawn attention and capital from that user base.
Market structure and momentum signals
On the technical front, FLR cleared a consolidation band it had traded within for roughly a week. The range between $0.023 and $0.025 acted as a short term equilibrium, and the breakout above this zone suggests sellers have been absorbed and buyers are reasserting control.
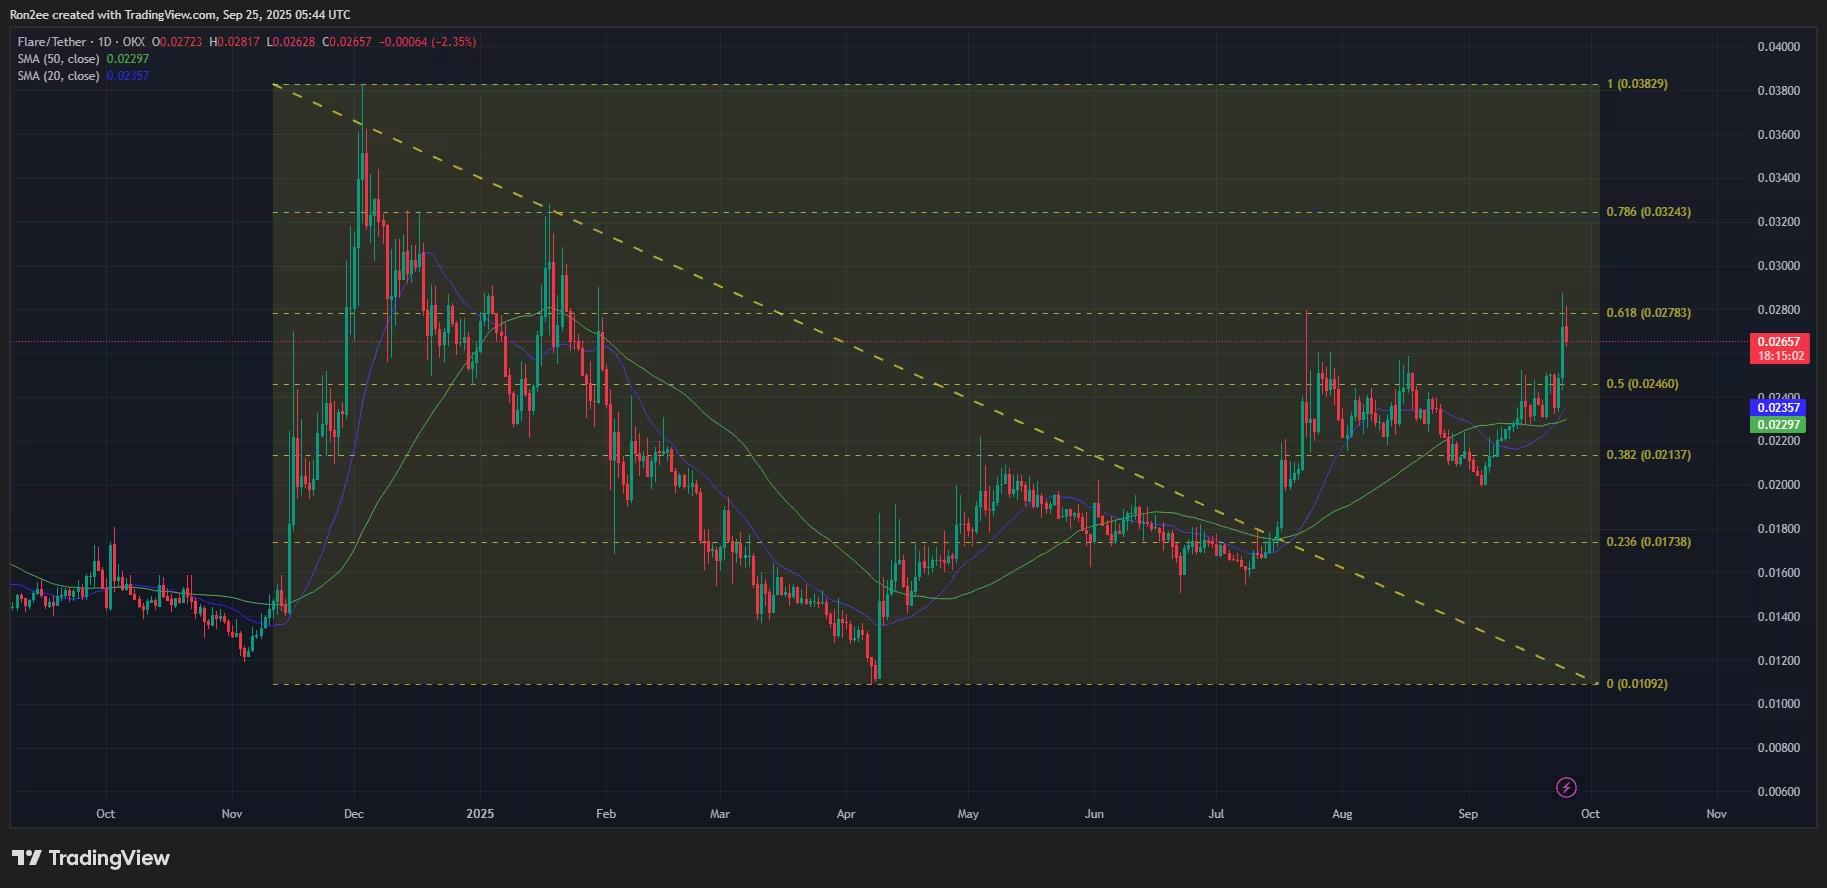
FLR price confirmed a bullish crossover of the 20-day and 50-day SMAs on the daily chart
The pro trend signal comes from a simple moving average (SMA) crossover. The 20 day SMA has moved above the 50 day SMA, forming the classic bullish crossover that many momentum traders use to identify the early stages of a sustained rally. Momentum indicators are supportive as well: MACD lines have turned upward and the slope is positive, while the relative strength index remains below typical overbought thresholds, leaving room for additional upside before a significant pullback becomes likely.
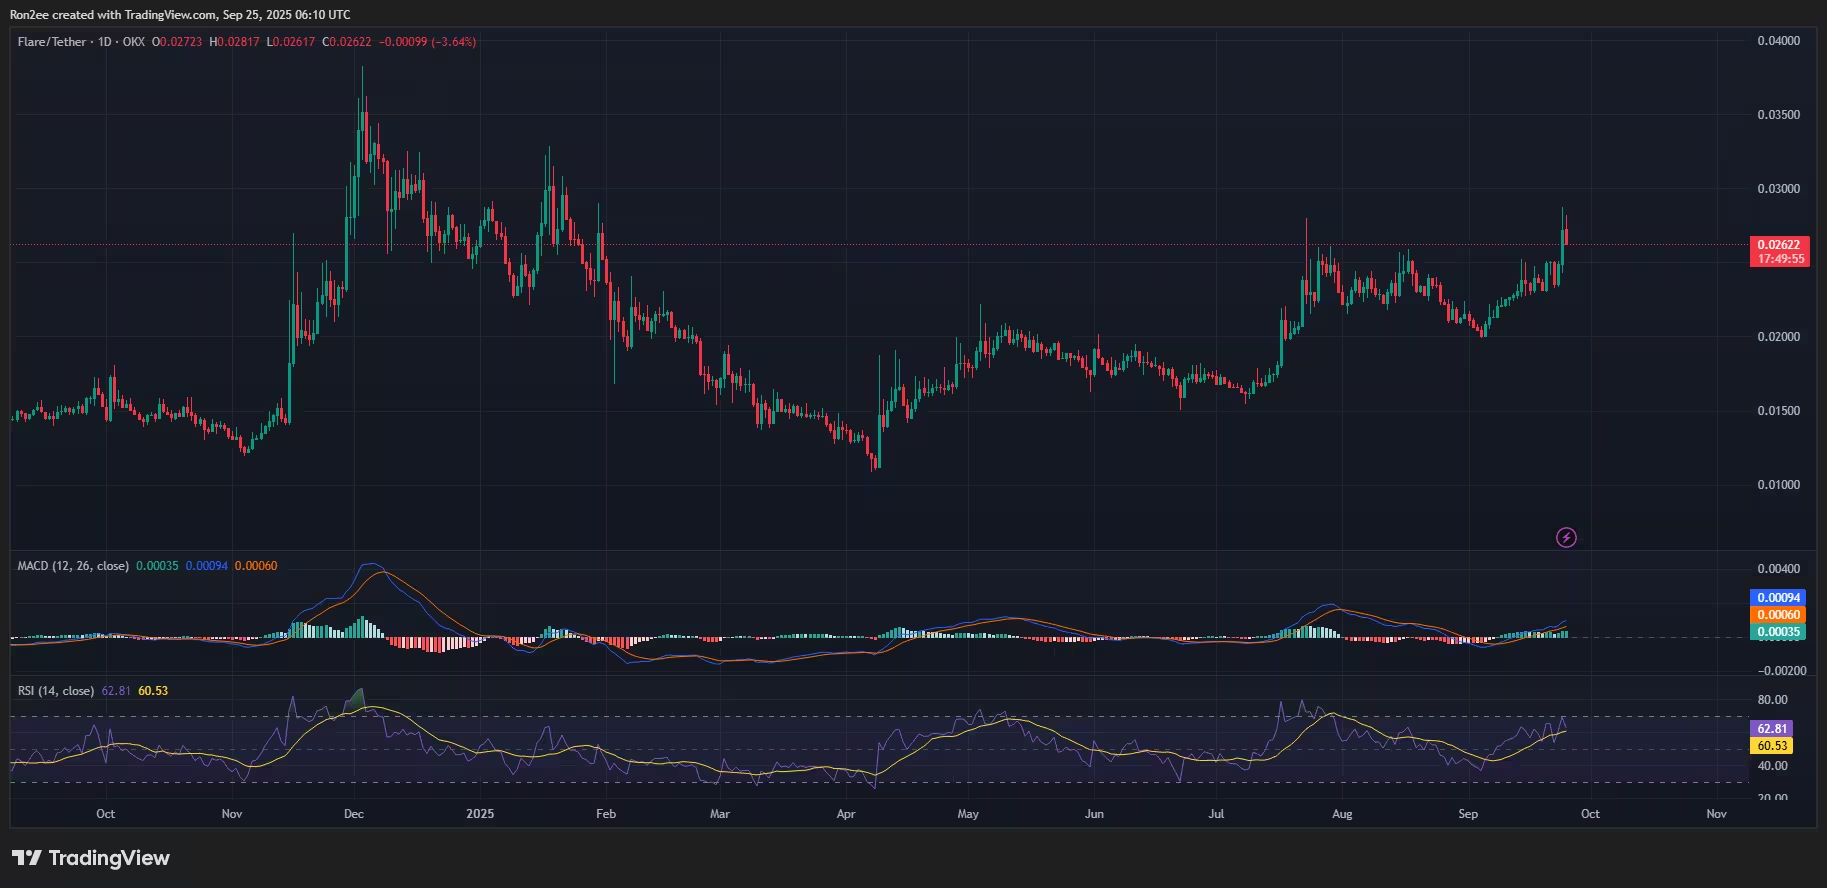
FLR MACD and RSI chart — Sep. 25
Volume, open interest, and trader positioning
High volume validates breakouts, and FLR's more than 350% daily volume surge indicates that this move is backed by participation across spot and derivatives markets. Along with rising derivatives volume, open interest in FLR futures increasing by nearly 24% highlights that new leveraged positions are being opened rather than old positions simply rotating. When open interest rises alongside price, it often confirms a trend that is gaining conviction rather than one that lacks follow through.
The long to short ratio above 2.4 across major time frames further reinforces bullish sentiment among traders. That said, high leverage can accelerate both gains and losses, so monitoring liquidations and funding rates is prudent for traders sizing positions around the move.
Technical targets and risk levels
Based on current technical structure and Fibonacci retracement analysis, a logical upside target for FLR sits near $0.032, which corresponds to the 61.8% Fibonacci retracement level. This target represents roughly 23% upside from the current trading level around $0.026. If the bullish momentum continues and broader market conditions remain supportive, reaching $0.032 over the short to medium term is plausible.
Key technical support is anchored near $0.023, which aligns with the 20 day SMA and the lower boundary of the prior consolidation range. A decisive break and daily close below $0.023 would weaken the bullish thesis and could open the door to a reversion toward earlier lows.
Scenario analysis
- Bull case: Continued adoption of FXRP drives onchain demand and liquidity. Volume and open interest expansion persist, the SMA crossover acts as a sustain signal, and FLR extends toward the $0.032 resistance zone. Positive social sentiment and cross community engagement from XRP holders help sustain flows into Flare DeFi.
- Bear case: The rally becomes short-lived if traders rotate profits or if broader crypto market risk-off triggers deleveraging. A failure to hold $0.023 would increase the likelihood of a deeper correction and temporarily invalidate the short term bullish setup.
What traders and investors should watch next
- Volume and open interest: Continued increases in both will support the bullish thesis. Watch for any divergence where price rises but volume or open interest falls, as that can signal weakening momentum.
- Funding rates and liquidations: Surges in long-side leverage could produce sharp corrections if funding becomes unsustainably high and large long positions are liquidated.
- RSI and MACD: The RSI can provide early warning of overbought conditions. MACD direction and histogram behavior will help confirm whether momentum is accelerating or stalling.
- Network and protocol developments: Additional FAssets launches or integrations that grow FXRP utility across DeFi would be structural positives for FLR tokenomics.
Conclusion
Flare has captured trader attention with a bullish SMA crossover, strong volume spikes, and expanding derivatives participation following the FXRP launch. These elements together make a convincing case that FLR could be setting up for further gains, with a practical near term target near $0.032. However, market participants should remain mindful of leverage risks and keep the $0.023 support zone in focus as the breakpoint that would signal a shift in the short term trend.
This analysis combines onchain product updates, sentiment indicators, and classical technical signals to give a comprehensive view of the current FLR setup. As always in cryptocurrency markets, trade size, risk management, and timely monitoring are essential.
Source: crypto
Leave a Comment