

Why is Bitcoin falling on October 20, 2026?
Bitcoin (BTC) slipped about 1.2% on October 20, trading near $81,730 after failing to sustain gains above $82,000. Weak institutional demand, renewed selling from derivatives desks, and lingering macroeconomic uncertainty tied to U.S. inflation and the Federal Reserve have put pressure on the crypto market. At the reporting snapshot, BTC dipped briefly toward $81,200 before recovering modestly; subsequent bids to push prices back above $82,000 proved short-lived.
Key takeaways
- BTC fell approximately 1.2% to near $81,730 on October 20 amid weak spot ETF demand and derivative selling.
- U.S. spot Bitcoin ETFs posted roughly $228.6 million in weekly outflows following a much larger $681 million withdrawal the previous week.
- On-chain metrics such as transaction fees and transfer volumes declined about 10%, while active addresses held relatively steady.
- Daily technical indicators — Ichimoku Cloud and Chaikin Money Flow (CMF) — signal continued bearish pressure, with notable support zones at $81,144 and the $80,000 psychological level.
- Short-term momentum indicators on the 4-hour chart (MACD crossover) hint at an easing of downside bias, but BTC must climb above $82,587 and then $83,457 to build a credible recovery.
ETF outflows and institutional demand: the primary drag
A major reason for today’s downturn is the ongoing lack of strong institutional inflows. U.S. spot Bitcoin ETFs recorded about $228.6 million in net outflows over the prior week, following approximately $681 million in withdrawals the week before. While the pace of outflows has slowed, the trend shows investors reallocating capital away from spot product exposure.
On-chain analytics firm Glassnode noted in an October 19 assessment that the intense selling seen in early October has eased, but there isn’t sufficient counter-demand from spot market participants and ETF investors to trigger a durable rebound. Perpetual futures traders have been net sellers, and ETF volumes have slipped below their typical ranges—reducing liquidity and amplifying price moves.
Options markets reinforce the cautious tone: the 25-delta skew rose, meaning traders are paying a premium to hedge against further downside. Elevated skew often reflects heightened downside fear in the market, which can exacerbate selling pressure in spot and derivatives venues.
Macro backdrop: inflation, Fed policy and market sensitivity
Macroeconomic variables remain central to BTC’s path. September’s U.S. consumer price index printed 3.7%, slightly above the 3.6% consensus, undermining hopes for an imminent easing in monetary policy. Higher-than-expected inflation increases the odds that the Federal Reserve will keep interest rates elevated for longer, which tends to push up Treasury yields and make interest-bearing instruments more attractive relative to non-yielding assets like Bitcoin.
Investors now await the Fed’s policy meeting on October 27–28, which is being treated as a pivotal event. Until that meeting is resolved, many traders will remain cautious, holding off on large directional bets. Additionally, a packed U.S. economic and corporate calendar this week—including earnings from Tesla and Meta, weekly jobless claims, and oil inventory data—adds more potential catalysts for short-term volatility.
Why higher rates matter for BTC

Bitcoin’s sensitivity to rate expectations stems from relative asset allocation. When bond yields rise, cash and fixed-income returns become comparatively more attractive, potentially drawing capital away from risk assets such as cryptocurrencies. That dynamic, combined with lower ETF inflows and thinner liquidity, can accelerate pullbacks in BTC price.
On-chain and market structure: what metrics are telling us
On-chain figures have cooled alongside price action. Transaction fees and transfer volumes fell by roughly 10% over the measured period, suggesting reduced network activity. Active addresses remained fairly stable, implying continued interest from retail and persistent participants, but not enough to offset institutional withdrawal and derivatives-driven selling.
Glassnode’s analysis also highlighted that perpetual futures traders were a prominent source of the early-month sell-off. When leveraged futures positions unwind in a thin market, they can create short-term downward spikes that struggle to find support without fresh bid interest from ETFs and long-term holders.
Technical outlook: daily and short-term charts
On the daily BTC/USD chart, bearish signals remain significant. Bitcoin was trading beneath key Ichimoku lines: the Tenkan-sen (~$81,974) and the Kijun-sen (~$83,457). With the Tenkan-sen below the Kijun-sen, the daily trend is tilted toward bears. BTC was also testing the lower portion of the Ichimoku Cloud, with a near boundary around $81,144. A decisive break under that level would expose the $80,000 psychological support and potentially the $77,500–$78,000 zone if selling intensifies.
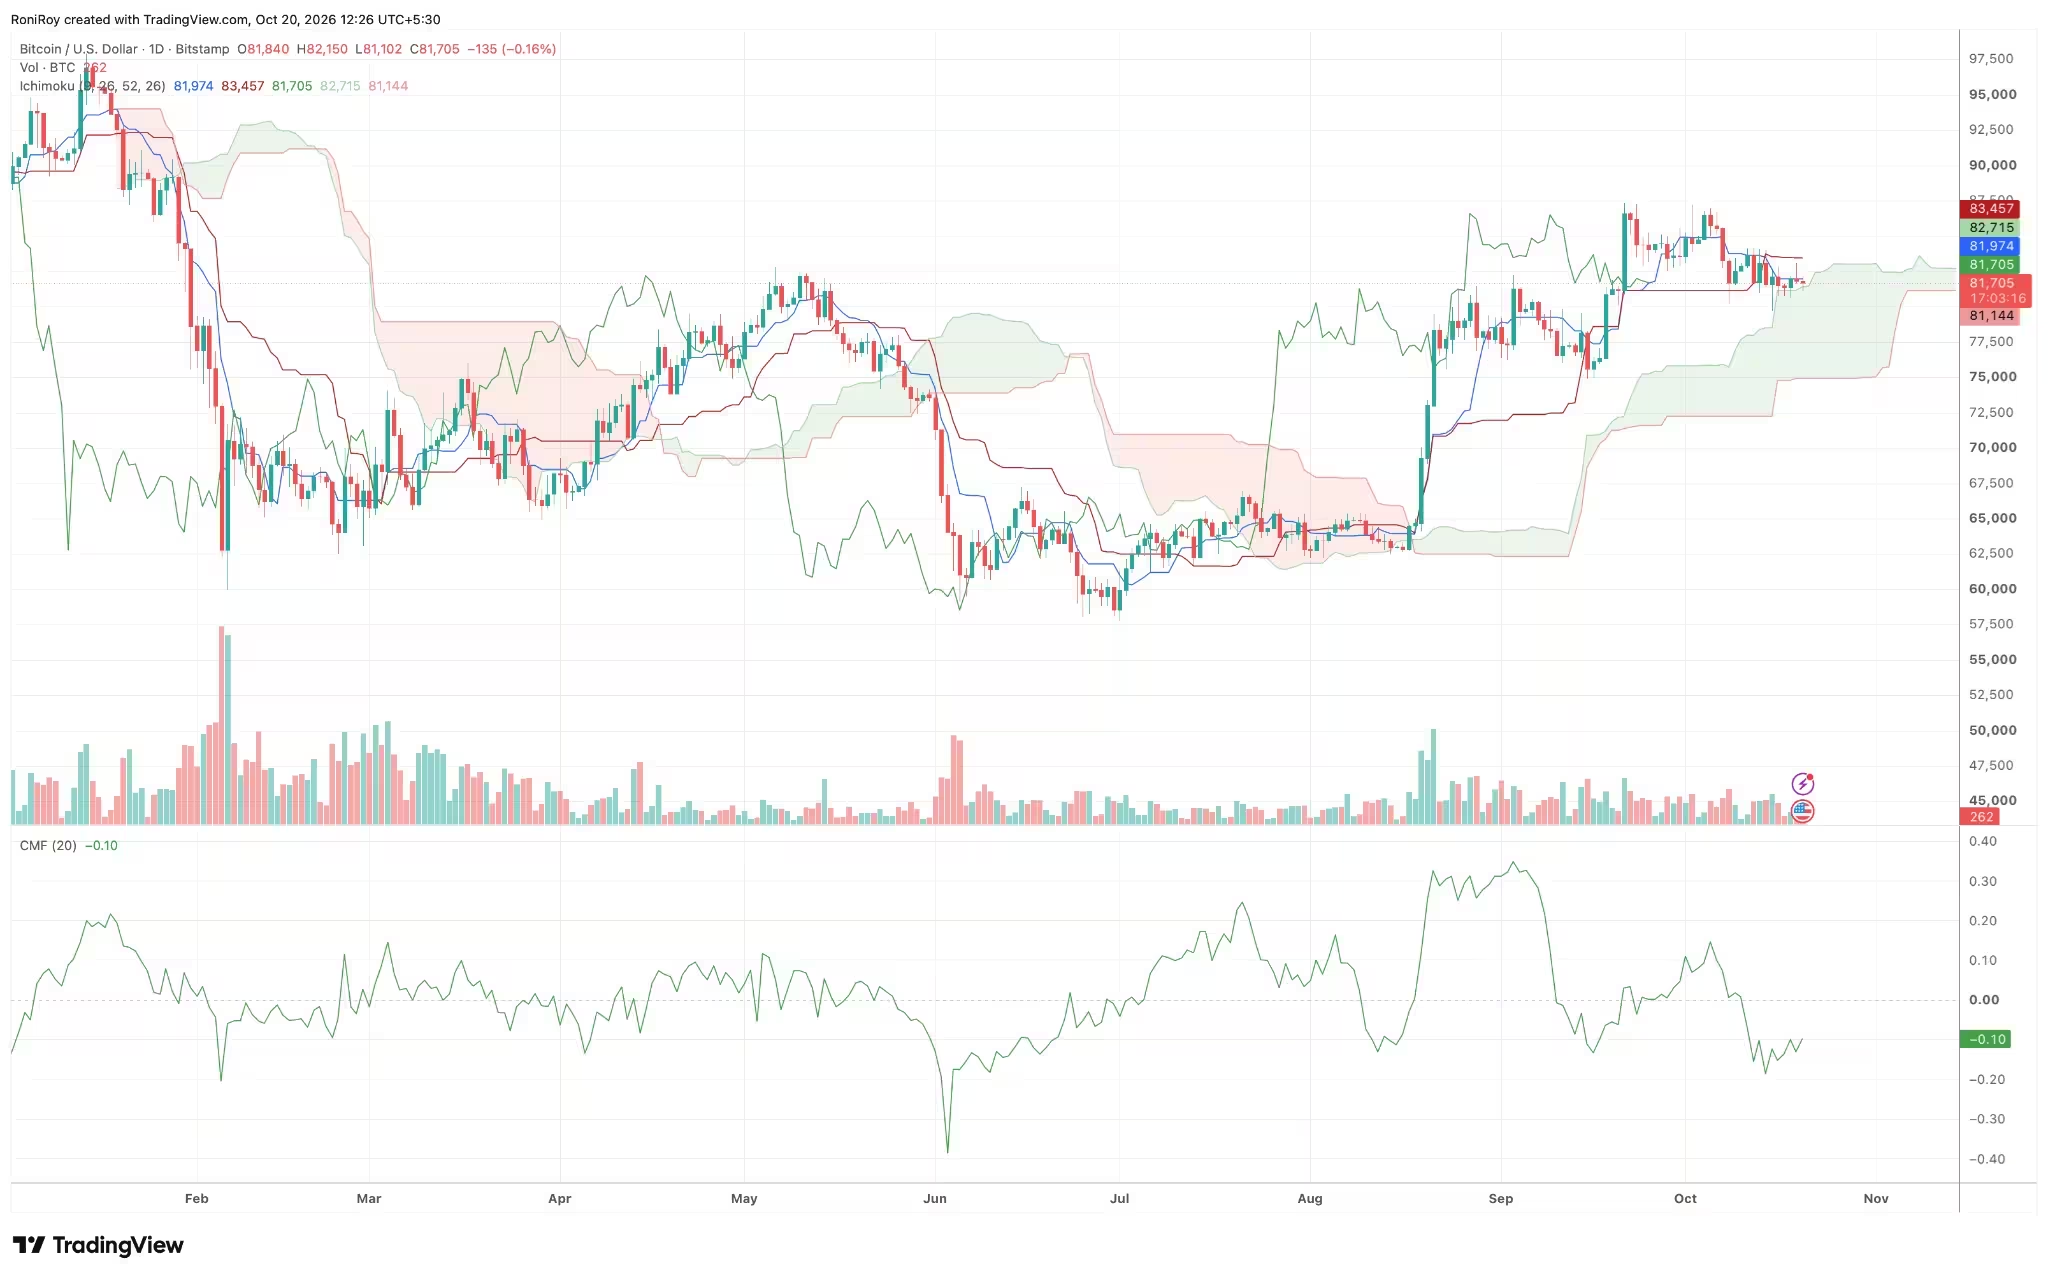
BTC/USD 1-day price chart.
The Chaikin Money Flow (CMF) read negative ~–0.10 on the daily timeframe, indicating distribution dominated accumulation over the measurement window. Other daily indicators were mixed: the 14-day Relative Strength Index (RSI) hovered near 47.7—neutral territory—while longer-term exponential moving averages maintained a mildly bullish tilt, leaving scope for a recovery if buying interest returns.
Short-term (4-hour) view: early signs of easing bearish momentum

On shorter timeframes, the picture was slightly more constructive. The 4-hour Moving Average Convergence Divergence (MACD) displayed a bullish crossover: the MACD line had crossed above the signal line, with a histogram turning positive, though both lines remained below zero. That suggests downside momentum is easing inside a still-weakened market structure.
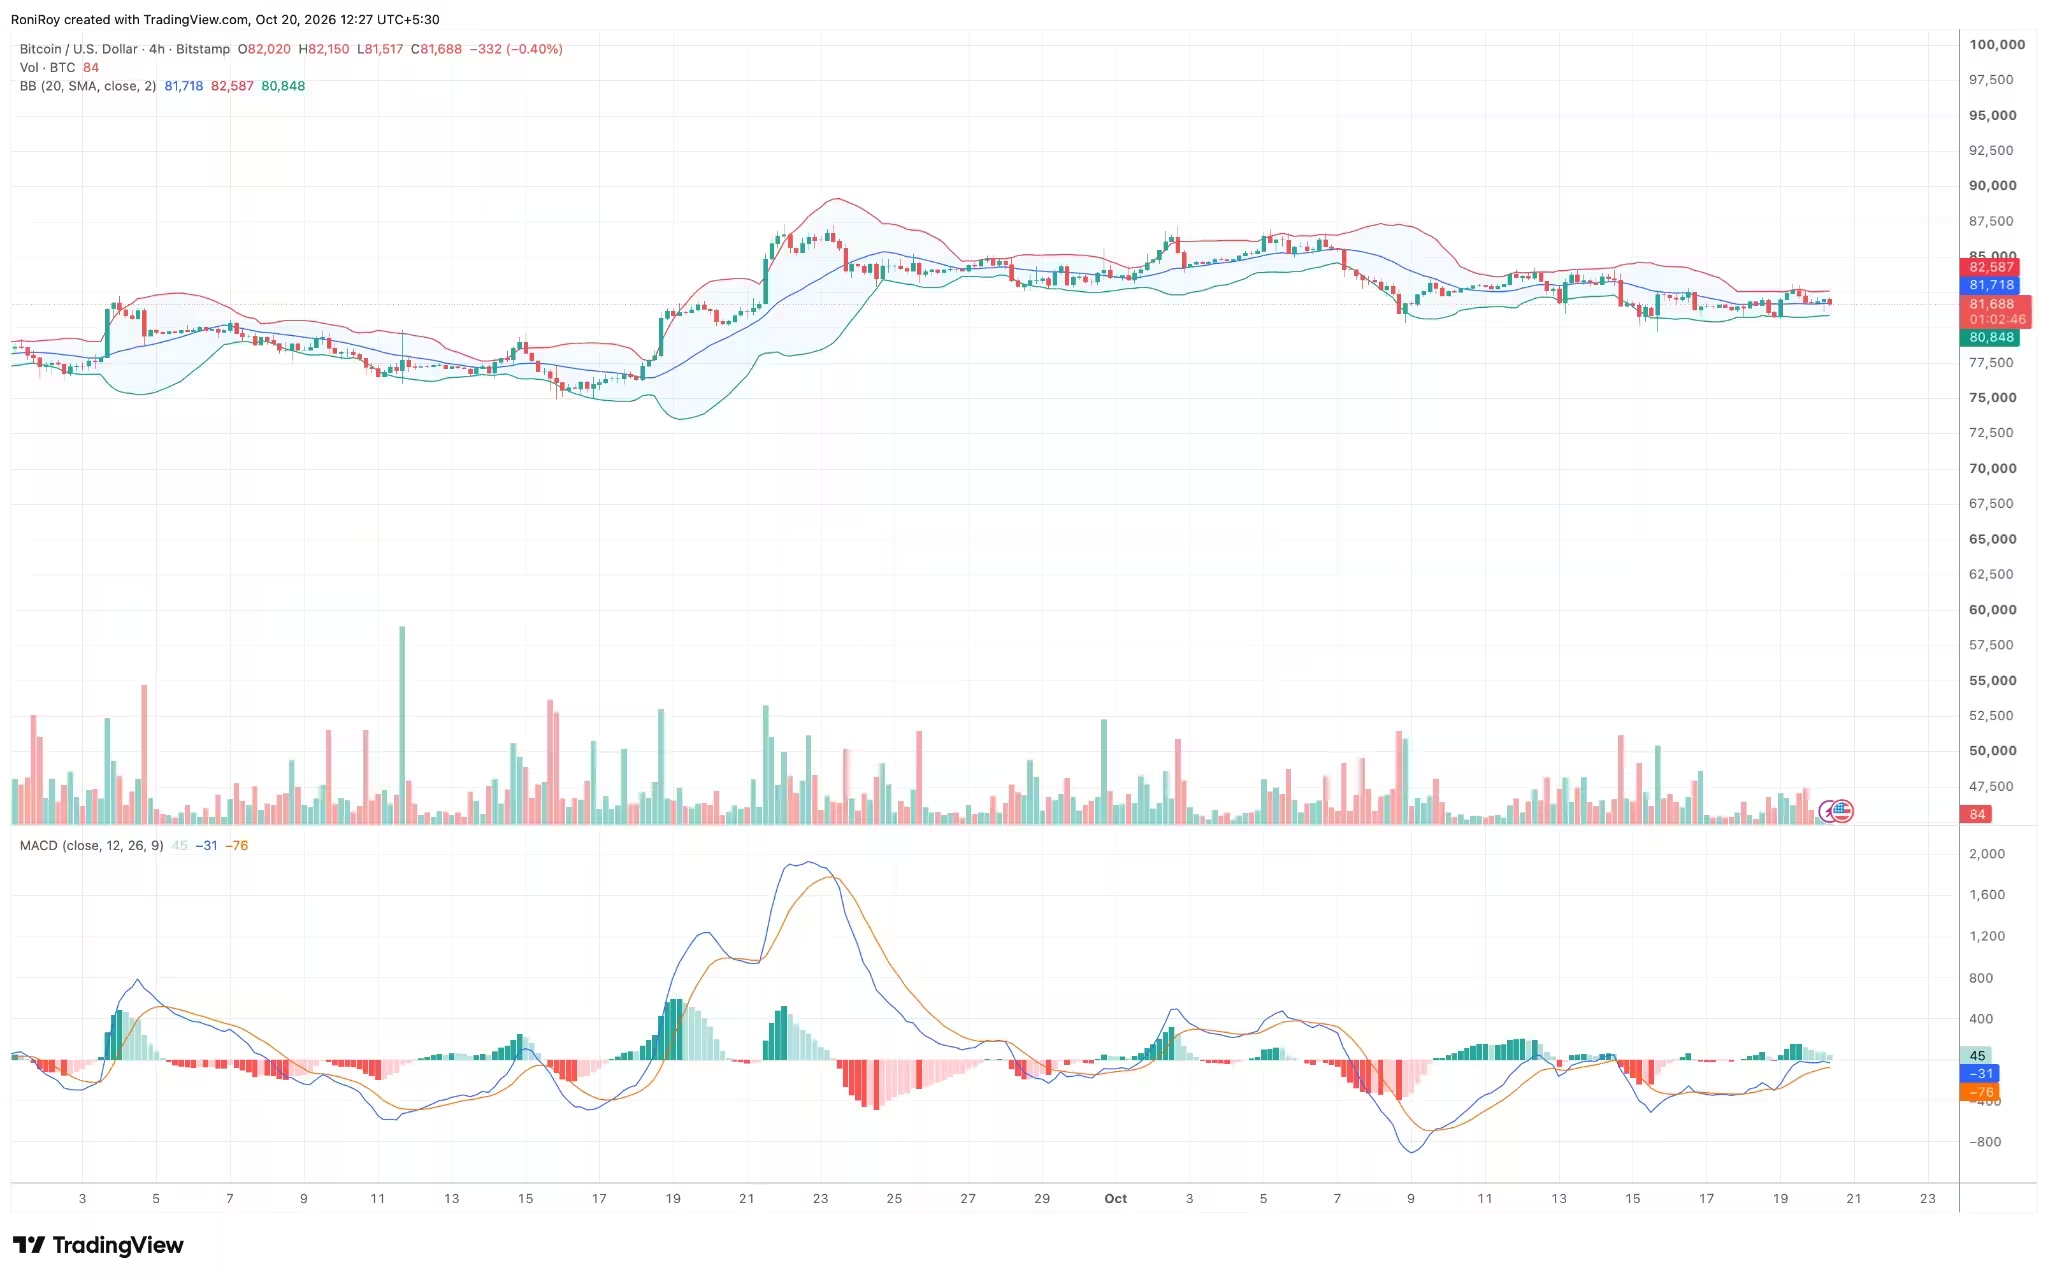
BTC/USD 4-hour price chart.
Price was trading near the middle Bollinger Band (~$81,718). A sustained move above that band could prompt a test of the upper band around $82,587, followed by resistance near $83,457, which aligns with the daily Ichimoku Kijun-sen. Failure to reclaim the mid-band would likely refocus attention on the lower band (~$80,848) and the $80,000 psychological level beneath it.
Analysts at Bitfinex have previously highlighted $81,300 as a pivot that shifted from resistance to support. Their view suggests that a clean recovery above $84,000 would be required to restore a stronger upward trend—an area BTC lost in early October.
What traders should watch next
Key price levels to monitor:
- Immediate resistance: $81,718 (4-hour middle Bollinger Band), $82,587 (upper band)
- Major resistance: $83,457 (daily Kijun-sen), $84,000 (higher resistance to reignite bulls)
- Immediate support: $81,144 (Ichimoku cloud boundary), $80,848 (4-hour lower Bollinger Band)
- Major downside targets: $80,000 psychological level; $77,500–$78,000 range if selling accelerates
Macro and market events to follow:
- Fed policy meeting (Oct 27–28) and subsequent commentary
- U.S. CPI and other inflation reads, weekly jobless claims
- Corporate earnings (e.g., Tesla, Meta) and their market impact
- ETF flows and volumes: whether spot ETF withdrawals stabilize or reverse
Bottom line

Bitcoin’s decline on October 20 reflects a convergence of factors: cooling ETF demand, derivatives-led selling, subdued on-chain activity, and an uncertain macro outlook driven by stubborn inflation and upcoming Federal Reserve decisions. While short-term momentum shows tentative improvement on the 4-hour MACD, BTC must reclaim and hold key resistance zones above $82,587 and $83,457 to mount a sustainable recovery. Until institutional flows improve and macro clarity emerges after the Fed meeting, BTC remains vulnerable to renewed selling that could test the $80,000 psychological level and potentially the $77,500–$78,000 area.
For traders and investors, watching ETF flows, options skew, and on-chain liquidity will provide clues about the next directional move in Bitcoin price.

Leave a Comment
Comments
No comments yet. Be the first.