

Cardano price overview: ADA retreats to weekly lows
Cardano (ADA) dropped more than 11% from its weekly open, trading near $0.223 on Oct. 17 as short-term momentum turned bearish. The pullback has pushed ADA toward the lower Bollinger Band on the daily chart and left several technical indicators signaling caution for traders and investors. Market commentators including Nehal, Jesse Olson, and Giannis Andreou have outlined conditional recovery scenarios, while on-chain data from Santiment and Cexplorer highlight shifting large-holder balances and network activity.
Key session and indicator readings
On TradingView’s Binance ADA/USDT daily and weekly feeds, ADA was quoted around $0.2231–$0.2232 on Oct. 17, showing an 11.57% decline on the weekly chart. The day recorded a high near $0.2258 and a low close to $0.2226, leaving ADA close to the bottom of the session range.
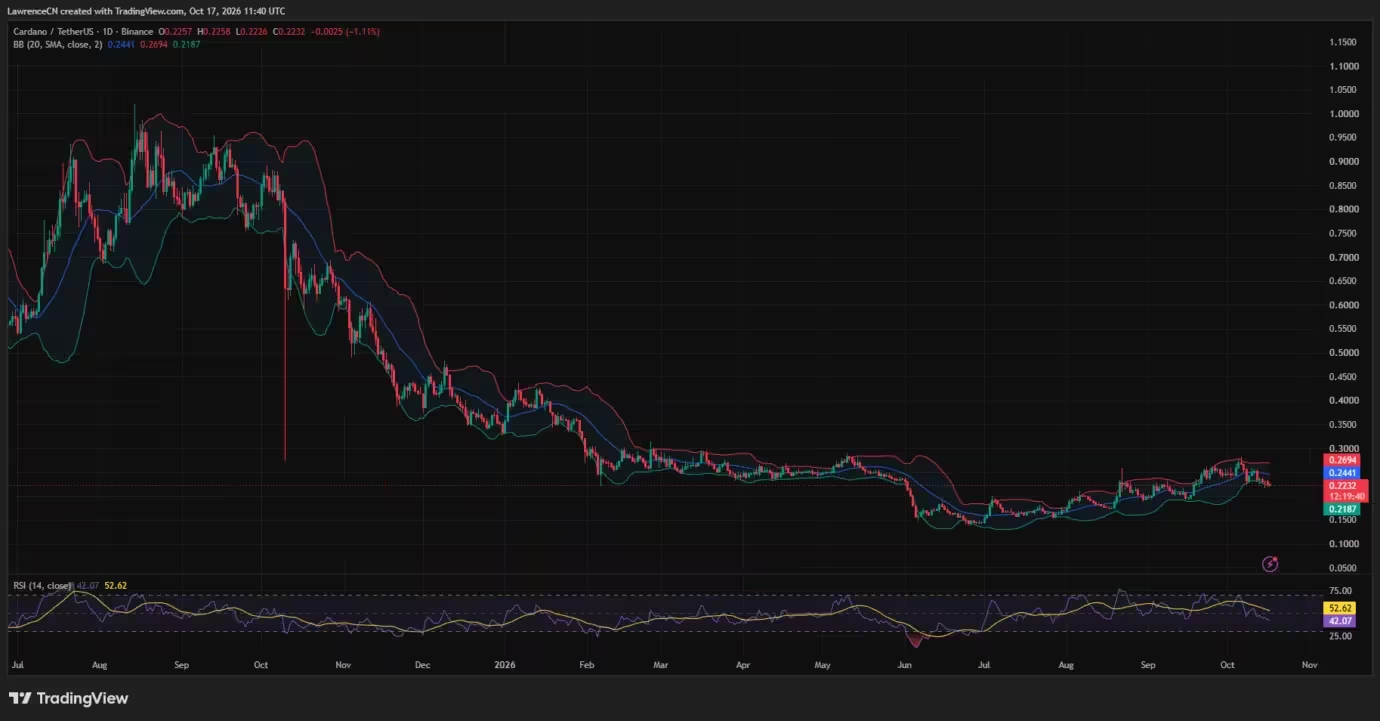
Cardano price daily chart — Oct. 17
The 20-day simple moving average (SMA) stood at $0.2441, with Bollinger Bands placing the upper band at $0.2694 and the lower band at $0.2187. ADA traded below the SMA and sat just above the lower band. From the $0.2232 reference, a move back to the middle band would require roughly a 9.4% gain, while the lower band was about 2% below the current price and the weekly low about 3.3% lower.
The daily relative strength index (RSI) read 42.07, under the neutral 50 threshold and below its displayed average of 52.62. While the RSI remains outside oversold territory, it shows weaker short-term momentum.
Analyst scenarios: breakout targets and invalidation levels

Several technical setups present conditional pathways for ADA. Nehal’s Oct. 16 commentary placed ADA on support between $0.21 and $0.22 while testing a long-term descending trendline on Coinbase charts. Nehal’s bullish thesis is straightforward: a clean daily breakout above that trendline could propel ADA toward $0.30 and then $0.36. He qualified the outlook with a clear invalidation point, noting that the bullish case would fail if ADA falls below $0.21.
Using Binance’s daily price of $0.2232 as a reference, reaching $0.30 would require roughly a 34.4% rally and $0.36 about a 61.3% climb. The invalidation threshold at $0.21 sits 5.9% below the Binance reading, underscoring that the forecast hinges on a confirmed breakout and sustained support rather than the current level alone.
On Oct. 14, analyst Giannis Andreou laid out a separate conditional recovery path that required ADA to hold $0.22–$0.24, reclaim $0.26–$0.28, and then attempt a breakout test at $0.2910. Andreou indicated that a confirmed break and retest of $0.2910 could put $0.3206 and $0.3698 into scope. Conversely, Andreou flagged $0.2110 and $0.19–$0.20 as potential downside targets if ADA loses the $0.22 support.
Jesse Olson had earlier highlighted bearish divergence and a potential lower high when ADA traded near $0.2434, an observation that preceded the more recent pullback. Comparatively, the previous support band around $0.224–$0.240 has been breached, with the latest readings roughly 8.3% below the Oct. 12 chart reference.
Momentum divergence across timeframes
Weekly momentum shows a slightly different picture. TradingView’s weekly MACD line remained above its signal line (MACD at −0.0111 versus signal at −0.0257) and the histogram was positive at 0.0145. That suggests the weekly MACD has retained a mild bullish bias despite the price decline, while the daily RSI stays below 50 — a mixed momentum signal across timeframes.
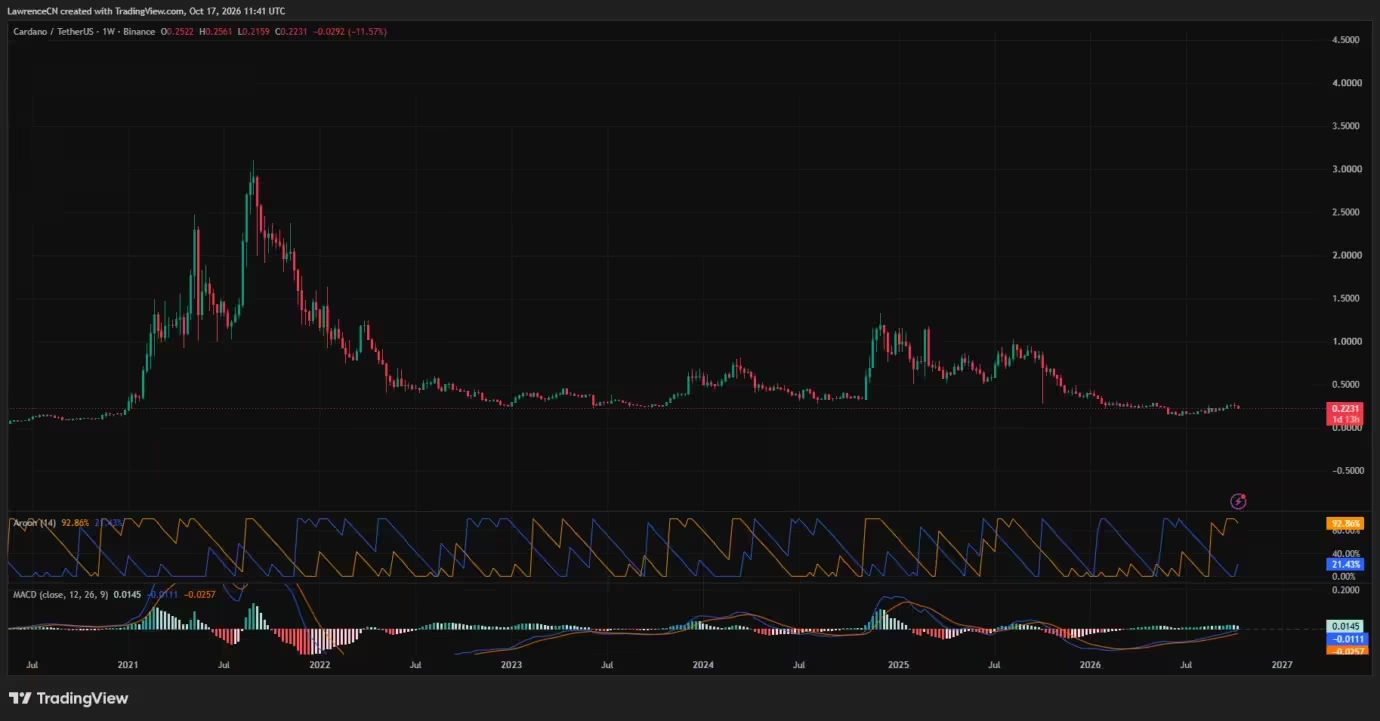
Cardano price weekly chart — Oct. 17
Liquidation heatmap and risk concentrations

Liquidation exposure data from CoinGlass indicates pockets of overhead liquidation clustered around $0.234–$0.235 and $0.240–$0.244, with a stronger concentration near $0.259–$0.260. On the downside, estimated liquidation bands appear around $0.220 and $0.215–$0.217. These heatmap values represent potential liquidation risk zones and not realized forced closures, but they can help traders gauge where short squeezes or stop cascades might occur if price moves sharply.
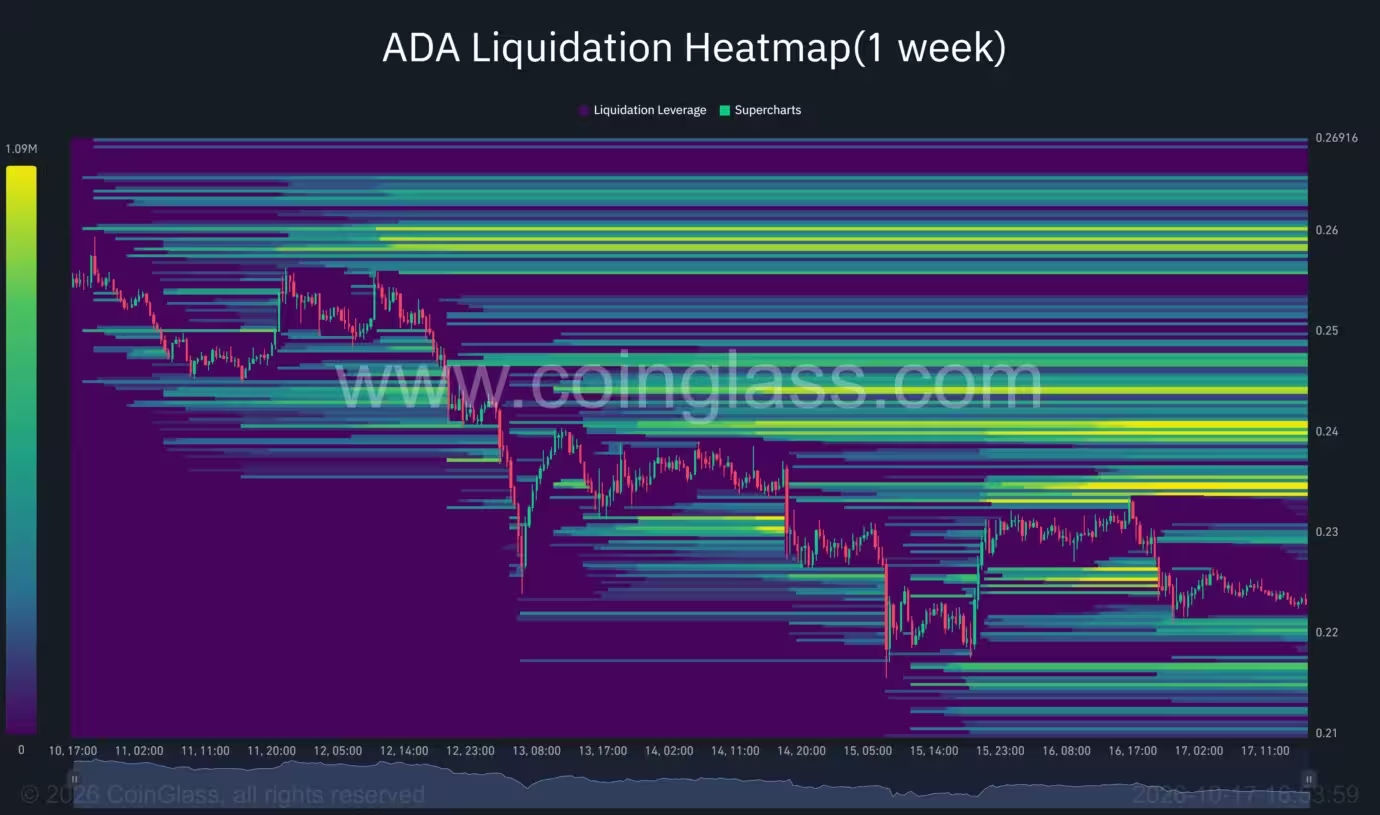
Cardano price liquidation heatmap
What traders should watch next
- Trendline and breakout confirmation: A clear daily close above the long-term descending trendline, with follow-through volume, would strengthen bulls’ case for the $0.30–$0.36 targets.
- Key support band: Holding $0.21–$0.22 remains critical. A decisive break below $0.21 would invalidate several bullish scenarios and could open deeper downside toward $0.19–$0.20.
- Overhead liquidity: Resistance and liquidation clusters above $0.234 and $0.240 are near-term roadblocks that bulls must clear to build momentum.
- Multi-timeframe momentum: Monitor the weekly MACD for continued bullish alignment and the daily RSI for signs of a recovery above 50.
On-chain signals: large-holder behavior and network activity
On-chain metrics have shown meaningful shifts in recent days. Analyst Ali Martinez cited Santiment data that large holders reduced combined ADA balances by more than 110 million ADA over a five-day window. Daily active addresses reported in that period fell from 27,248 to 15,977, a decline of 41.36% — signaling a notable drop in short-term network participation during the earlier reporting window.
Cexplorer reported strong transaction throughput in Epoch 660 (Oct. 6–11), with 1,780,896 transactions processed — eclipsing the previous record of 1,566,974 transactions set in Epoch 304 (Nov. 2021). Epoch 660 averaged 83.83 transactions per block and recorded roughly 337,720 ADA in fees, indicating healthy on-chain usage despite price pressure.
Separately, DRepTalk’s treasury tracker showed 457,395,629 ADA consumed against a 500 million ADA withdrawal limit for epochs 613–713, leaving an allowance of 42,604,371 ADA (about 8.5% of the ceiling). Notable allocations in the withdrawal table included 120 million ADA for AlphaGrowth’s Cardano PRIME and 50 million ADA earmarked for the Cardano x Draper Dragon Orion Fund. The tracker clarifies that the limit constrains treasury outflows, not the overall treasury balance.
Outlook and conclusion
Cardano’s recent 11% weekly drop places ADA at a critical juncture. Short-term momentum is bearish but not yet capitulative, and weekly MACD retains mild positive alignment. Analysts present conditional recovery scenarios with clearly defined invalidation levels: a confirmed breakout above the descending trendline and sustained support above $0.21 are prerequisites for the optimistic $0.30–$0.36 targets. Traders should monitor Bollinger Bands, RSI, MACD, and the CoinGlass liquidation heatmap for confirmation signals, while on-chain metrics and large-holder activity provide important context for underlying demand.

For crypto investors and traders, the coming days will be decisive: a successful breakout could shift sentiment quickly, while a breakdown below $0.21 would likely intensify short-term selling and expose deeper support levels. Keep an eye on exchange order flow, volume confirmation, and the liquidation zones highlighted above to manage risk effectively.

Leave a Comment
Comments (1)
Whoa 11% in a week... ADA flirting with $0.21 is nerve wracking, tbh. Trendline breakout or bust imo, but that big holder selloff worries me. Need volume to confirm!