

Bitcoin hovers near $81.7K as bulls and bears clash
Bitcoin (BTC) has slowed its advance around $81,731 after a volatile week that saw price briefly dip beneath $80,000. The pause below the $84,000 area — and specifically beneath the 20-day Bollinger midpoint — has left traders and analysts divided over whether the rebound can sustain enough momentum to test the $90,000 zone.
Key market snapshot
On Binance, BTC traded close to $81,731, roughly 2.44% below the weekly opening price. Daily Bollinger Bands place the 20-day midpoint at $83,477.61, with the upper band at $86,362.74 and the lower band at $80,592.47. That structure keeps price nearer to the lower boundary than to the central average, signaling a fragile recovery from the intraday sell-off earlier in the week.
TradingView’s Binance BTC/USDT charts at 8:11 a.m. UTC on Oct. 17 showed Bitcoin above its weekly low of $79,800 but below the week’s opening price of $83,773. The week’s high reached $84,352, placing the market inside a range that has already been crossed in both directions during recent sessions.
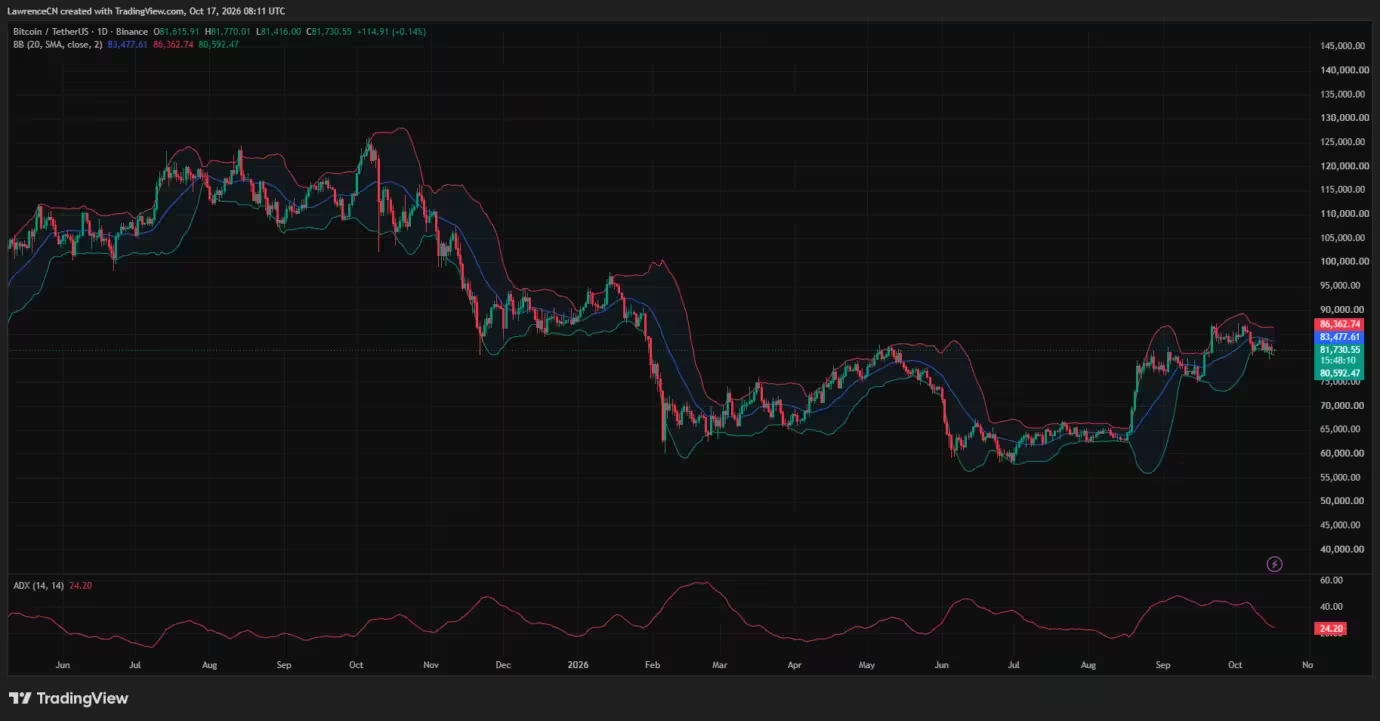
Bitcoin price daily chart — Oct. 17
Bollinger Bands and daily trend
With price roughly 2.1% under the daily Bollinger midpoint and about 1.4% above the lower band, BTC’s intraday positioning suggests buyers are defending the lower-BB area but have not yet reclaimed the short-term mean. Historically, the midpoint often functions as a magnet during consolidations; a decisive break above it would improve odds for additional upside toward the upper band near $86,363.
Momentum readings
TradingView’s daily Average Directional Index (ADX) read 24.20 after easing from earlier October levels. An ADX below 25 typically points to a weakening trending environment, meaning even if direction is currently down, the trend’s strength has softened — a nuance traders track when sizing positions for potential breakouts or reversals.
Analysts split on the path to $90K
Market commentators have offered opposing scenarios. The bullish conditional view — promoted by a contributor known as Wealthmanager — highlights Bitcoin’s bounce from $80,000 within a descending channel. The thesis: a clean breakout above $84,000 could set the stage for a run to $90,000. From the TradingView reference price of $81,730.55, moving to $84,000 would require about a 2.8% gain; reaching $90,000 would be roughly a 10.1% advance.
Not all technicians agree. Jesse Olson described BTC as “bearish on the daily chart,” arguing the session appeared poised to print the correction’s lowest daily close. Similarly, trader Ardi set a more conservative breakout threshold of $84,200 before considering long exposure toward the range top — about $200 above Wealthmanager’s breakout level.
Earlier in the week, trader Lennart Snyder linked the pullback from a session high above $84,100 to the U.S. inflation release and identified $80,300 as a near-term downside target. Those mixed perspectives underscore a classic technical tug-of-war: a narrow path to upside requires reclaiming the mid-BB while downside risks persist until that confirmation arrives.
Weekly indicators: momentum still above neutral

On the weekly frame, RSI remained above the neutral 50 line at 56.75, with its displayed average near 51.82. That weekly momentum reading suggests buyers retain some control despite price trading 2.44% below the week’s opening level. The weekly Supertrend line printed a green signal at $66,811.57, positioning Bitcoin about 22.3% above that indicator.
While the weekly Supertrend sits well below recent intraday lows — nearly $13,000 under the $79,800 weekly low — it indicates the broader trend remains constructive absent a deeper multiweek breakdown.
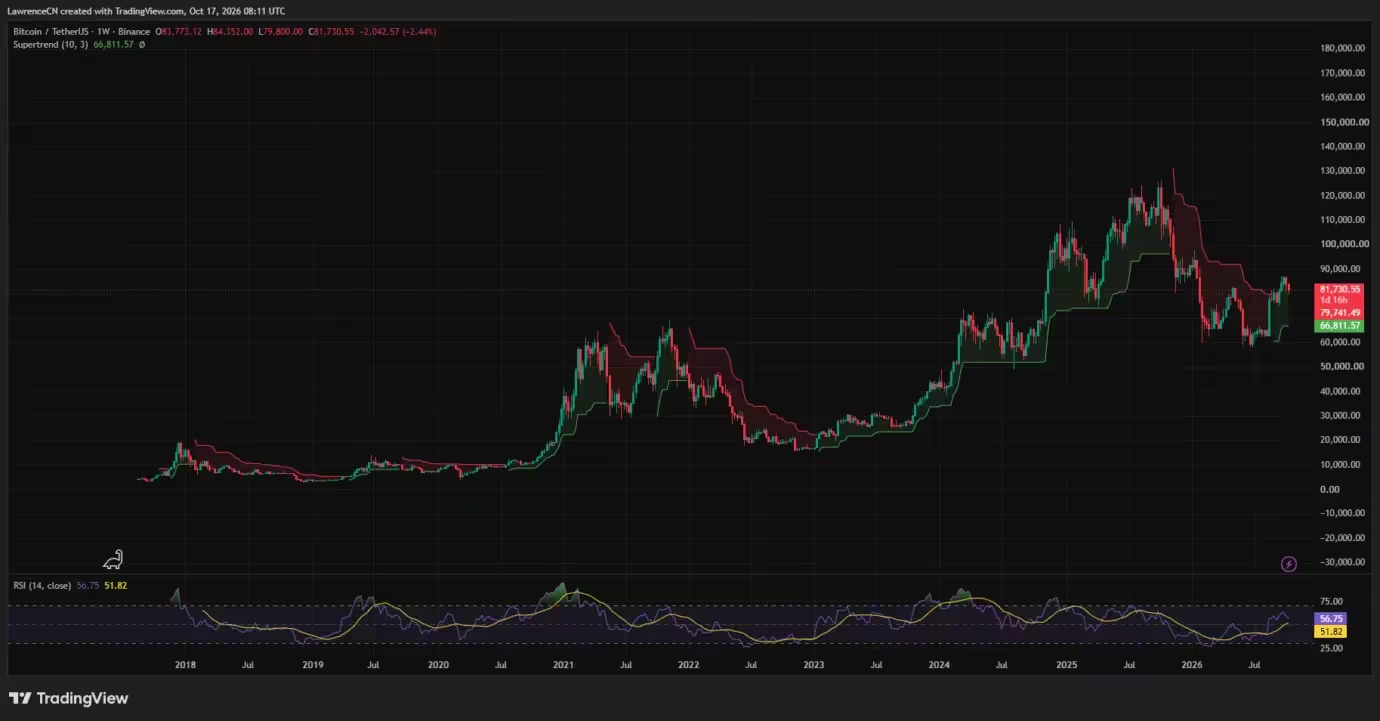
Bitcoin price weekly chart — Oct. 17
Liquidity clusters and liquidation risk
Heatmaps from CoinGlass illuminate where liquidation concentrations pile up. The most prominent overhead bands showed estimated clusters around $84,400–$84,800, with smaller concentrations between $83,200–$83,700. Lower bands appeared near $80,000–$80,800 and beneath $80,000.
These pockets matter because stops and leveraged positions often concentrate around such levels. A push above the $84.4–84.8K zone could trigger short-covering and cascade into a sharper leg higher; conversely, another dip below $80,000 may flush weaker longs and expose the market to further downside pressure.
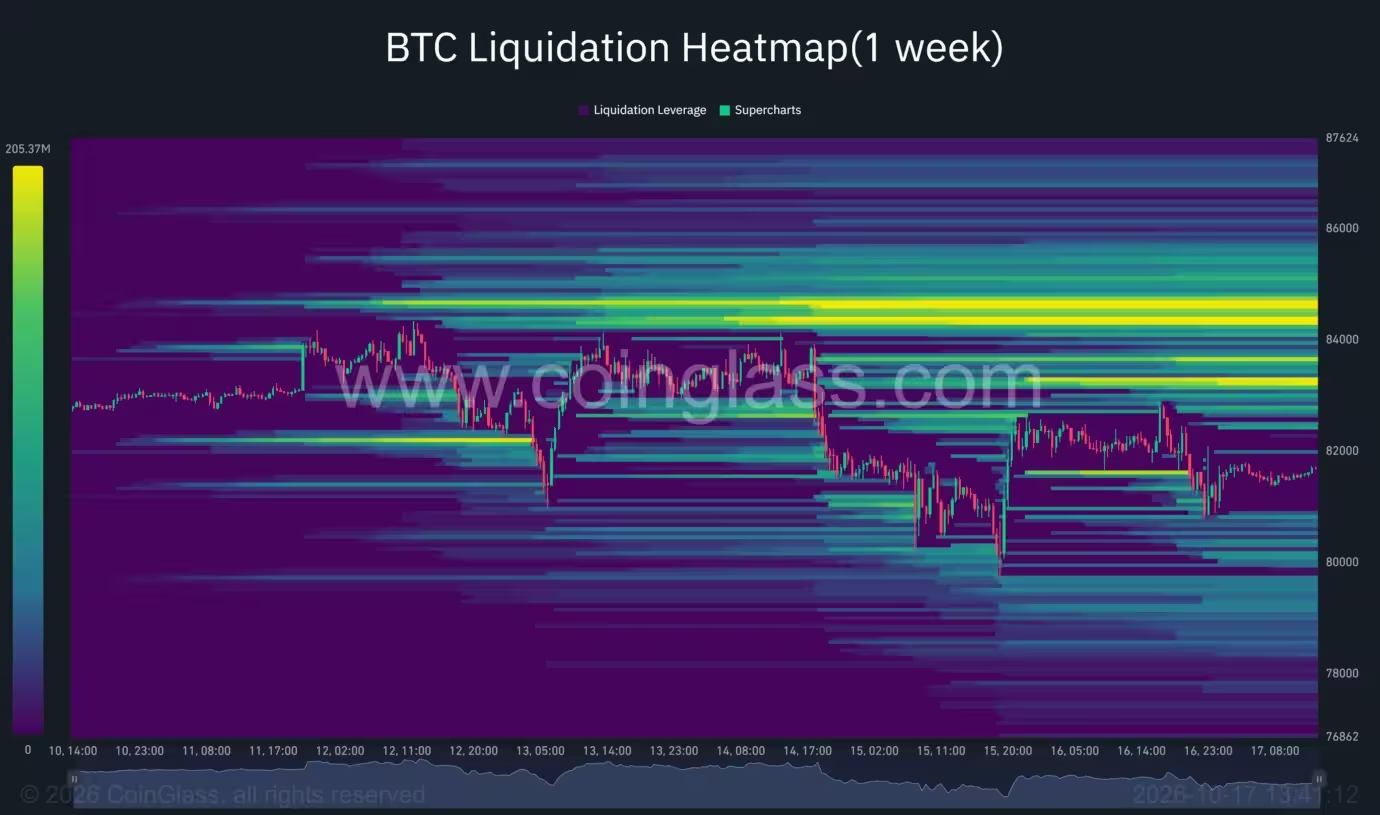
Bitcoin liquidation heatmap
Macro backdrop: U.S. inflation and ETF flows
Price action this week unfolded against fresh U.S. inflation data. The Bureau of Labor Statistics reported September consumer price inflation at 3.7% year-over-year and 0.6% month-over-month on Oct. 14. Producer Prices (PPI) followed with a 6.3% annual increase and a 1.3% monthly rise in final-demand prices. Those prints can influence risk sentiment, rates expectations and, by extension, allocation to risk assets such as cryptocurrencies and crypto ETFs.
Flows into and out of spot crypto ETFs have also been a key market driver. Crypto ETFs lost $610.7 million as Ethereum outflows overtook Bitcoin in recent sessions, and analysts at Bitfinex warned that sustained trading below $81,300 coupled with ETF withdrawals could reopen downside objectives around $77,000 and the $77,200 True Market Mean.
Trading implications and risk management
For traders and investors, near-term guidance is straightforward: reclaiming the daily Bollinger midpoint (~$83.48) and clearing the liquidity cluster near $84.4–84.8K would materially improve bullish odds and could validate targets toward $90K. Aggressive downside scenarios remain intact while BTC trades below the midpoint, with notable support levels at $80,300 (a trader-quoted target), the $80,000 psychological mark and the lower daily Bollinger near $80,592.
Risk management is crucial. Given the concentration of liquidations around overhead and underfoot bands, position sizing, clear stop levels and contingency plans for sudden macro-driven volatility will help market participants navigate either a breakout or a renewed correction.
In short, Bitcoin’s immediate fate hinges on whether buyers can retake the Bollinger midpoint and neutralize the overhead liquidation density. Until then, analysts will remain split between a conditional path to $90K and a more cautious stance that expects further consolidation or a pullback toward the high-$70Ks.


Leave a Comment
Comments (1)
Weird chop, bulls fight hard but bears too. If BTC can't hold mid BB, expect messy range... ETF outflows scary, imo. Nervous lol