

Bitcoin retakes $82,000 after short-lived slide under $80,000
Bitcoin recovered above $82,000 on Friday, October 16, after briefly slipping below the $80,000 mark during a volatile session. The rebound erased much of Thursday’s losses as Asian equity markets stabilized and institutional flows in spot Bitcoin ETFs showed modest net inflows. CoinGecko data recorded BTC near $82,035, and market capitalization hovered around $1.65 trillion as traders assessed macroeconomic data, ETF activity, and technical levels that will likely dictate the cryptocurrency’s near-term direction.
Market snapshot and intraday range
CoinGecko recorded BTC trading at $82,034.56 with a market cap near $1.649 trillion and roughly $32.88 billion in 24-hour volume. Over the prior 24 hours Bitcoin moved between $79,805.99 and $82,508.10, briefly dipping under the $80,000 threshold for roughly two hours before buyers stepped in and pushed prices back toward $82,500.
The move lower followed a risk-off reaction to hotter-than-expected U.S. inflation metrics and renewed weakness in tech stocks. Still, the recovery left BTC trading below the widely watched $84,000 resistance level that analysts say must be cleared to confirm a sustained uptrend.
Macro drivers: inflation, yields and equities
U.S. inflation data weighed on markets earlier in the week. September consumer inflation printed 3.7% year-over-year, above the expected 3.6%, while wholesale inflation climbed 6.3% annually. Producer prices also surprised to the upside with a 1.3% month-over-month rise—the largest monthly jump since March 2022—renewing concerns that the Federal Reserve may keep interest rates elevated for longer.
Those inflation prints coincided with a pullback in technology shares and a spike in U.S. Treasury yields. The benchmark 10-year Treasury yield touched roughly 5.07% as bond prices fell, creating headwinds for risk assets including Bitcoin.
At the same time, Asian markets staged a recovery that paired with BTC’s rebound. South Korea’s Kospi rose nearly 3% as semiconductor names rebounded, while MSCI’s Asia Pacific index gained about 1.3%. Samsung Electronics and SK Hynix each advanced more than 2%, helping sentiment across regional equity markets even as Taiwan Semiconductor remained under pressure amid investor scrutiny of AI-related capital spending.
ETF flows and institutional behavior

Institutional fund activity presented a mixed picture on Thursday. According to SoSoValue, U.S. spot Bitcoin ETFs recorded combined net inflows of about $5.06 million. BlackRock’s iShares Bitcoin Trust (IBIT) led inflows with $16.79 million, but the aggregate figure was muted because several other funds saw outflows that offset part of BlackRock’s purchases.
U.S. spot Ethereum ETFs moved in the opposite direction, with roughly $60.22 million in net outflows during the session. BlackRock’s iShares Ethereum Trust (ETHA) reportedly accounted for $44.39 million of that withdrawal volume.
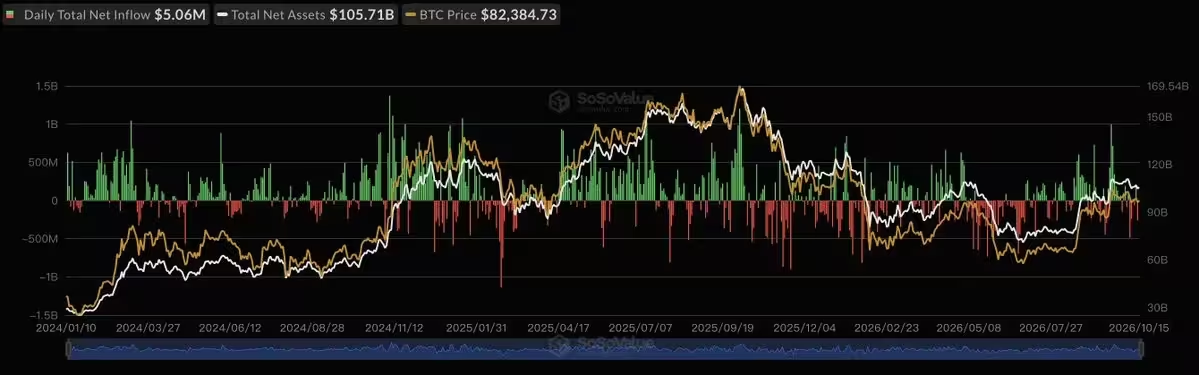
U.S. spot Bitcoin ETF flows
Analysts flagged ETF demand as a key variable in Bitcoin’s ability to hold support. ViaBTC analyst Jeff Ko emphasized that institutional buying would need to resume more robustly to support a sustained rally, while BTSE COO Jeff Mei said stronger-than-expected inflation readings could pressure BTC’s near-term performance.
Technical picture: support, resistance and indicators
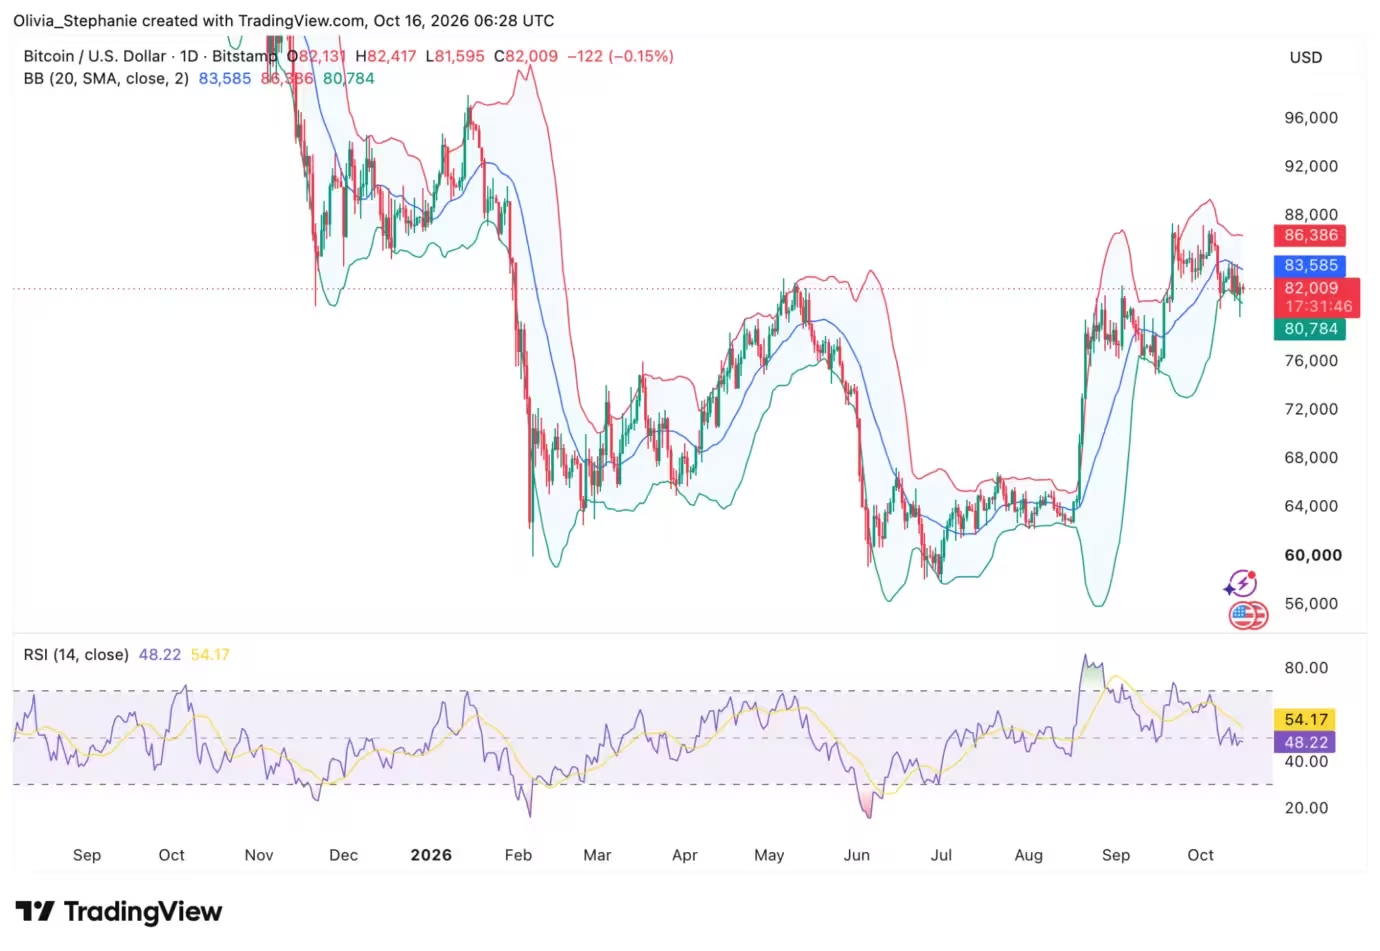
Crypto chart analysts see immediate technical support around $81,500, with a cluster of liquidity and resistance above $84,000 that could be tested if buyers keep pushing. Daan Crypto Trades highlighted a rebound from the 0.618 Fibonacci retracement level and pointed out that BTC had moved back above the $81,500 horizontal level while approaching its four-hour 200-period moving average and exponential moving average—key trend-following indicators many traders use.
Another analyst, Ted Pillows, noted that BTC had bounced from roughly $79,725 to $81,390 before settling into a consolidation band. He observed that BTC was trading near $81,200, where the 50-period simple moving average created an additional technical barrier. According to Pillows, returning open interest—about $300 million after the decline—would be a bullish sign, and a daily close above $81,200 would strengthen the recovery case. Conversely, rejection could pull Bitcoin back toward $80,300 or the $79,700–$80,000 zone.
Bitcoin (BTC) price chart

Bollinger Band readings placed the middle band at $83,584, the upper band at $86,387 and the lower band at $80,781. These bands reflect recent volatility and provide potential trading boundaries rather than guaranteed price targets. The Relative Strength Index (RSI) stood at 48.14, below its moving average of 54.16, suggesting upward momentum had not yet fully returned above the neutral 50 threshold.
From a scenario perspective, a sustained move above the Bollinger middle band at $83,584 could open the path toward the upper band near $86,387. Conversely, falling below the lower band at $80,781 would put the prior $79,800 swing low back under pressure, with $78,000 and $76,000 cited as lower support levels.
Key technical levels
- Immediate support: $81,500
- Short-term resistance: $83,584 (Bollinger middle band)
- Next upside target/liquidity zone: above $84,000
- Potential downside supports: $80,781 (Bollinger lower), $79,800, $78,000, $76,000
On-chain data: whale wallets at record highs
Blockchain analytics provider Santiment reported that the number of Bitcoin wallets holding between 10 and 10,000 BTC reached an all-time high of 20,338 addresses. Santiment noted the category had expanded sharply since mid-July, even as BTC went through multiple price swings.
Santiment's findings indicate growing accumulation among large addresses—entities that can meaningfully influence supply dynamics. The analytics firm emphasized that this cohort includes exchanges, custodians and institutional holders as well as high-net-worth individuals; therefore, wallet counts are an imperfect proxy for unique investors. Still, the rise in sizable wallets is typically viewed as a bullish structural signal because it suggests persistent demand from major holders during corrections.
Santiment cautioned that rising wallet counts do not guarantee prices will not decline further in the short term, but the data is encouraging for longer-term buyers who watch supply concentration closely.
Corporate purchases and market structure
Large corporate and institutional purchases continue to shape market sentiment. Strategy, the company formerly known as MicroStrategy and founded by Michael Saylor, disclosed another acquisition of 250 BTC for approximately $21.5 million. According to Strategy’s recent filing, the firm reported holdings of 848,250 BTC as of October 11, purchased for about $64 billion including fees and expenses. The same disclosure showed Strategy repurchased $192.4 million of its STRC preferred shares during the week ended October 11—roughly nine times the capital it spent on its latest BTC purchase—highlighting the varied ways public crypto companies are allocating capital.
What traders and investors should watch next
Several near-term variables will likely determine Bitcoin’s directional bias:

- Macro data: Additional U.S. inflation and jobs figures will continue to influence rate expectations and Treasury yields, which in turn impact risk asset flows into cryptocurrencies.
- ETF flows: Continued net inflows into spot Bitcoin ETFs could provide steady buying support, while persistent outflows (or weak demand) would increase downside risk.
- Technical confirmation: Sustained closes above $83,500–$84,000 would give bulls more confidence, while failure to hold $81,200–$81,500 increases the odds of revisiting the $79,700–$80,300 range.
- On-chain accumulation: Further increases in large-wallet holdings would be a structural positive for long-term supply dynamics.
Bottom line
Bitcoin’s rebound above $82,000 after a brief dip under $80,000 reflects a market balancing macro pressures, technical levels and institutional activity. While short-term momentum remains fragile—RSI and moving averages have not decisively turned bullish—the combination of ETF inflows, growing large-wallet accumulation and a recovery in Asian equities provides a foundation for higher prices if buyers can clear the $84,000 zone. Traders should monitor inflation data, Treasury yields and ETF flows closely, as these will remain key catalysts for BTC price direction in the coming days and weeks.

Leave a Comment
Comments
No comments yet. Be the first.