

Cardano price, technical risks and on-chain signals
Cardano (ADA) recovered around 3% to trade near $0.2235 on October 21, yet recent technical indicators and on-chain metrics have put traders on alert. A bearish flip of the SuperTrend indicator and a close watch on whale balances suggest a scenario in which ADA could slip toward $0.17 if critical daily support fails. This article breaks down the technical picture, whale activity, key support and resistance levels, and the Cardano Foundation's regulatory response to the EU MiCA review.
Key takeaways
- ADA rose roughly 3% to $0.2235 on October 21 despite bearish technical cues.
- Analyst Ali Martinez flagged a bearish SuperTrend signal and warned a break below $0.21 could push ADA to $0.17 (~24% downside).
- Whales holding 100M–1B ADA showed little net change over the previous 10 days, per Santiment.
- Immediate resistances: $0.2255 and $0.2394. Immediate supports: $0.22 and $0.21, with $0.20 psychological level below.
- Cardano Foundation submitted a MiCA consultation response advocating activity-based regulation for staking and DeFi.
SuperTrend flip raises alarm for ADA technical traders
Crypto analyst Ali Martinez highlighted a fresh sell signal after Cardano’s SuperTrend indicator turned bearish on October 20. Martinez compared the latest read to a SuperTrend flip on May 22 that preceded a sizable 46% correction. While he cautioned that history doesn’t have to repeat, the similarity makes the current signal notable for market participants focused on technical analysis and risk management.
Why the $0.21 level matters
Martinez placed the lower boundary of Cardano’s ascending channel around $0.21. In his framework, a daily close beneath this level would confirm a breakdown from the channel and open the path toward $0.17 — a roughly 24% decline from the Oct. 21 price near $0.2235. That target is not arbitrary: it reflects the channel-based projection and the next layer of historical support. Until ADA prints a confirmed daily close under $0.21, the breakdown remains a warning rather than a confirmed trend reversal.
On-chain: whale wallets remain unusually stable
On-chain intelligence firm Santiment shows that wallets holding between 100 million and 1 billion ADA have maintained relatively flat balances across the past ten days. Martinez noted that changes in this cohort historically coincided with significant ADA moves, so the current lack of pronounced accumulation or distribution leaves the bearish SuperTrend signal without immediate on-chain corroboration.
That said, this 10-day window and the specific wallet-size filter do not capture every large investor. Earlier in October, reports highlighted meaningful selling among some major holders — including a reduction of more than 110 million ADA over five days — which coincided with weaker network activity and a decline in daily active addresses.

What to watch in whale activity
- Renewed decreases in whale balances alongside a daily close below $0.21 would strengthen the bearish case and signal fresh distribution.
- Conversely, a visible accumulation trend in the 100M–1B ADA cohort could mitigate downside risk and support a technical recovery.
Price structure: moving averages, RSI, volume and targets
On the daily chart ADA traded near $0.22 and was slightly below key short-term moving averages. The 9-day moving average sat at $0.2255, while the 21-day moving average was at $0.2394. With the shorter MA under the longer MA, the bias favored sellers in the short run.
The Relative Strength Index (RSI) stood at 44.35, under its signal average of 46.09 and below the neutral 50 threshold, indicating relatively weak momentum but not yet an oversold condition. Market volume for the 24-hour window was around $254 million, with prices oscillating between $0.21468 and $0.226044.
Immediate technical levels to monitor
- Resistance: $0.2255 (9-day MA), $0.2394 (21-day MA), then $0.2488 if buyers reassert control.
- Support: $0.2200 immediate, then $0.2100 as channel support; a sustained break below $0.21 would expose $0.20 and the $0.17 target noted by Martinez.
In short, traders will be watching whether ADA can reclaim the $0.2255 level to regain short-term momentum. Failure to do so alongside a bearish daily close beneath $0.21 would increase the likelihood of a deeper retracement.
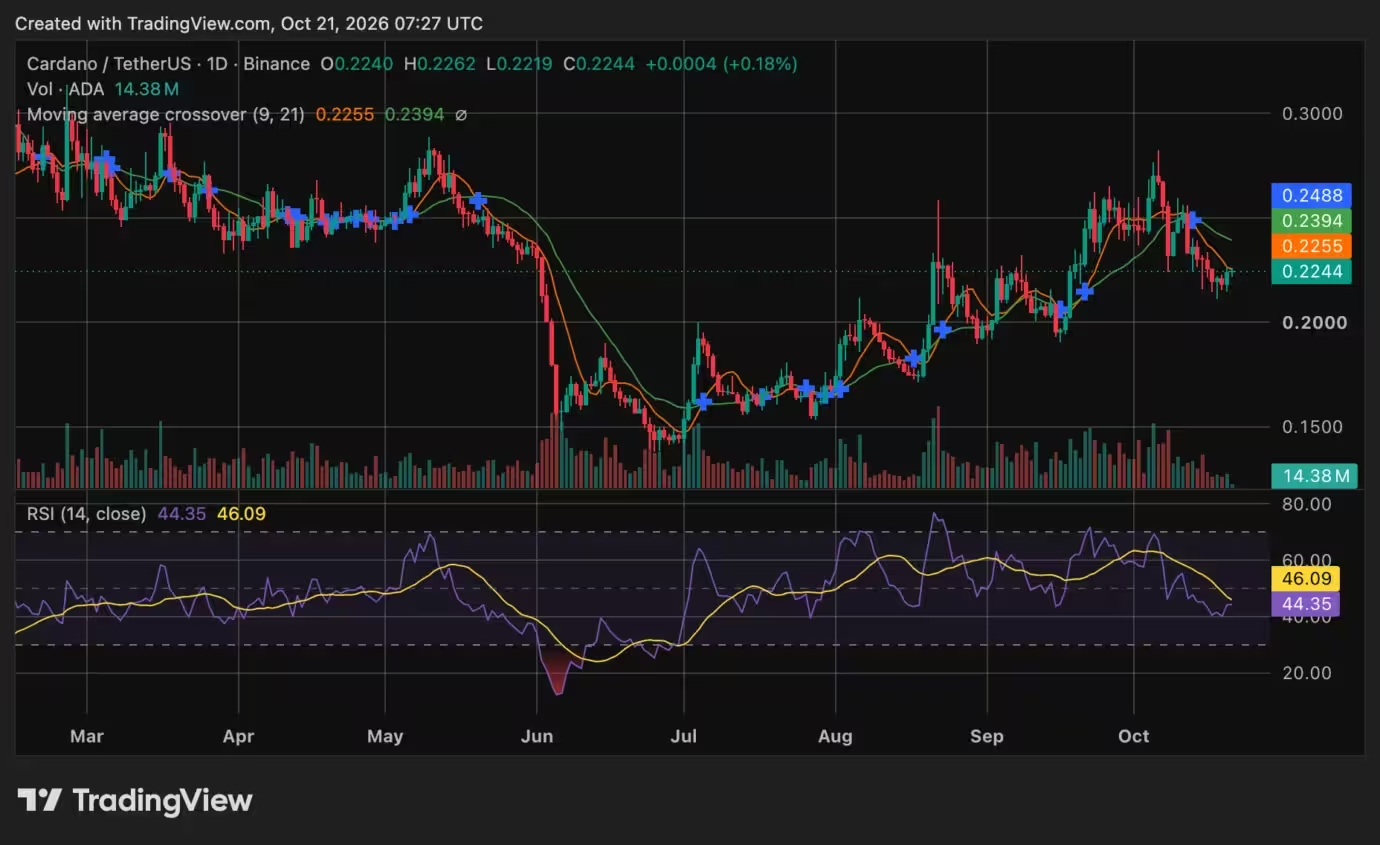
Cardano (ADA) price chart
Broader market context and short-term scenarios
Over the past seven days ADA remained roughly 5% lower despite midweek gains, with market capitalization near $8.4 billion. The broader crypto market environment, macro liquidity, and leading large-cap tokens’ momentum will influence Cardano’s trajectory alongside its own technical and on-chain drivers.

Bull case
If ADA clears $0.2255 and holds above the 9-day moving average, buyers could target $0.2394 and then $0.2488. Positive catalysts — such as renewed on-chain activity, large-holder accumulation, or bullish industry news — could accelerate a recovery toward those levels and potentially re-open a move toward $0.30 in a stronger scenario.
Bear case
A confirmed daily close below $0.21 coupled with continued SuperTrend bearish momentum and renewed whale selling would increase the odds of a slide toward $0.17. That scenario would represent roughly a 24% drop from the Oct. 21 price near $0.2235 and would likely coincide with softer network metrics and lower daily active addresses.
Regulatory backdrop: Cardano Foundation responds to EU MiCA review
Beyond price action, the Cardano Foundation published its MiCA consultation response on October 21 after earlier submitting feedback to the European Commission. The foundation urged regulators not to create separate frameworks for decentralized finance and staking, recommending that rules focus on actual activities and risk profiles rather than blanket categorizations.
Specifically, the response distinguished protocol-level staking from custodial staking services run by intermediaries, arguing that regulatory obligations should reflect whether a service involves custodial control, token custody, or third-party custody operations. The consultation spans DeFi, staking, lending, stablecoins, and tokenized assets — areas that will shape enterprise and developer strategy across the blockchain space.
What traders and investors should monitor
- Daily closes around $0.21 — confirmation below opens the path to deeper losses.
- SuperTrend and moving average crossovers for short-term trend confirmation.
- On-chain metrics: whale balances in the 100M–1B ADA range, daily active addresses, and exchange inflows/outflows.
- Regulatory developments around MiCA that may affect staking and DeFi operations in Europe.
In conclusion, Cardano’s immediate outlook is balanced between a guarded recovery and risk of a deeper pullback. Technical indicators like the SuperTrend and short-term moving averages favor caution, while on-chain whale data has not yet provided decisive evidence of renewed distribution. Traders should combine technical levels, on-chain signals, and broader market context when sizing positions and managing risk.

Leave a Comment
Comments (1)
Is the SuperTrend flip really the same as May 22? Seems premature. 10-day whale data is tiny, could be noise... still, $0.21 break would sting, watch closely