5 Minutes
Institutions Accumulating Bitcoin at Scale
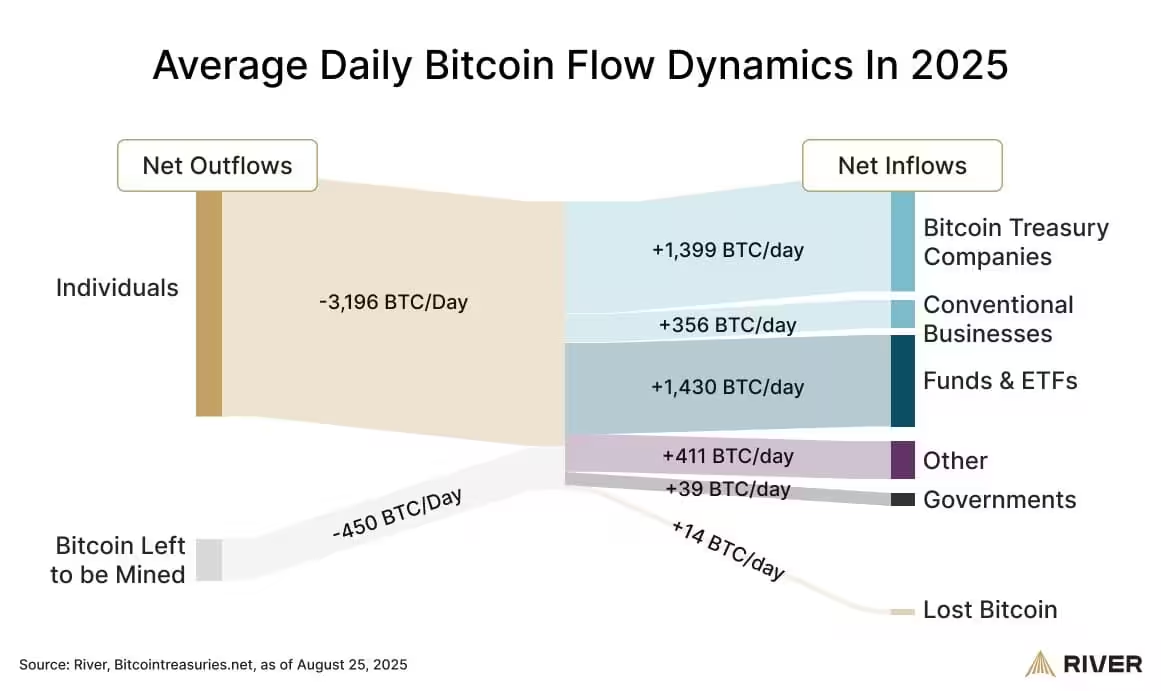
River Financial’s recent flow infographic highlights a striking dynamic in the bitcoin market: businesses appear to be taking in bitcoin at almost four times the rate miners are producing new coins. That snapshot, dated Aug. 25, shows broad institutional demand—treasury holders, traditional companies, funds and spot ETFs—removing meaningful quantities of BTC from liquid supply each day.
Key figures from River’s flow map
- Businesses (treasuries and operating companies): ~1,755 BTC/day
- New miner issuance in 2025: ~450 BTC/day
- Funds and spot ETFs: ~1,430 BTC/day
- Other institutional flows: ~411 BTC/day
- Government-related flows: ~39 BTC/day
- Lost or permanently inaccessible bitcoin: ~14 BTC/day
- Net outflow from addresses labeled as individuals: ~–3,196 BTC/day
How River arrives at the numbers
River’s visualization is a Sankey-style flow diagram that maps net movements of BTC between categories of holders. The company combines public filings, custodial address tagging, heuristics and external databases to classify address ownership. For miner issuance, River uses the post-halving subsidy—3.125 BTC per block—multiplied by roughly 144 blocks per day to arrive at about 450 BTC of new supply daily in 2025. These calculations make the core claim: businesses are absorbing nearly four times daily miner supply.
What the lines in the flow map represent
It’s important to emphasize that the Sankey diagram shows net balances, not every individual trade. Thick lines indicate larger net movements into or out of categories. For example, a business-tagged wallet rising by +1,755 BTC/day could reflect multiple activities—spot purchases, over-the-counter (OTC) deals, custodial transfers or treasury rebalancing—rather than only exchange buys.
Institutional demand beyond corporate treasuries
Alongside companies that publicly hold BTC on their balance sheets, River highlights growing fund-level demand. Spot ETFs and other investment vehicles account for roughly 1,430 BTC/day in inflows according to the snapshot, further tightening available supply. Smaller institutional channels and government-related flows add to the absorption picture, while a modest but persistent stream gets categorized as lost bitcoin—coins that River deems permanently inaccessible due to key loss or other issues.

Retail vs. institutional movement
River tags individual addresses as the largest net outflow cohort (about –3,196 BTC/day). That metric does not necessarily indicate retail selling pressure. Instead, River’s classification suggests many coins are shifting from addresses it considers individual-held to ones identified as institutional, custody, or corporate wallets. In short, the net outflow from retail-tagged addresses may partly reflect consolidation into professional custody rather than market exits.
Implications for bitcoin supply and market dynamics
When cumulative inflows to businesses, funds and ETFs exceed miner issuance, the immediate effect is a tightening of readily available BTC on the market. Reduced liquidity at the margin can amplify price moves if demand remains steady or increases. River warns, however, that their flow map is not a price prediction; it’s a supply-side snapshot showing how ownership patterns could shift over time.
Why this matters to traders and long-term holders
For traders, a persistent drain of circulating supply into long-term holder accounts or custody could lead to increased volatility and sharper reactions to macro news or on-chain events. For long-term investors and corporate treasuries, continued accumulation by institutions may change the market structure—elevating the role of funds and corporate balance sheets in defining net supply availability.
Limits and caveats: interpreting River’s estimates
River is transparent that its numbers are estimates, not a definitive census. Wallet tagging can misclassify addresses, and public disclosures do not cover every holder. Net flows into a labeled category can result from internal transfers, custody migrations or OTC trades that don’t reflect fresh spot demand. Readers should view the infographic as a directional tool for understanding supply dynamics rather than an exact accounting of every BTC movement on the blockchain.
Ultimately, River’s Aug. 25 snapshot underscores a larger structural trend: if businesses, funds and ETFs continue to absorb more bitcoin than miners produce, institutions will increasingly influence bitcoin’s effective supply—potentially reshaping liquidity and market behavior over the medium to long term.
Source: coindesk


Leave a Comment