
4 Minutes
Ether Faces a Critical Test at the $4,000 Level
Ethereum is trading under pressure after a fresh sell-off pushed ETH lower this week, leaving the token clinging to an important ascending trendline. Historically, that trendline has preceded substantial rallies — making the next few sessions crucial for bulls and crypto traders tracking ETH price action.
Key takeaways
- ETH’s breakdown from a symmetrical triangle increases the risk of a near-term correction toward roughly $3,560.
- Bulls need to protect the rising trendline near $4,000 to prevent a deeper decline.
- Technical setups and Wyckoff-based scenarios still leave room for a long-term breakout if support holds.
Technical setup points to a possible 15% correction
Ether has lost more than 7.5% this week amid broader de-risking across cryptocurrency markets. The recent drop followed a break below a symmetrical triangle pattern, a formation that can act as a continuation or — when broken to the downside — a reversal signal. The measured move derived from that triangle puts a near-term target in the $3,560 area, implying roughly a 15% decline from current levels if sellers remain in control.
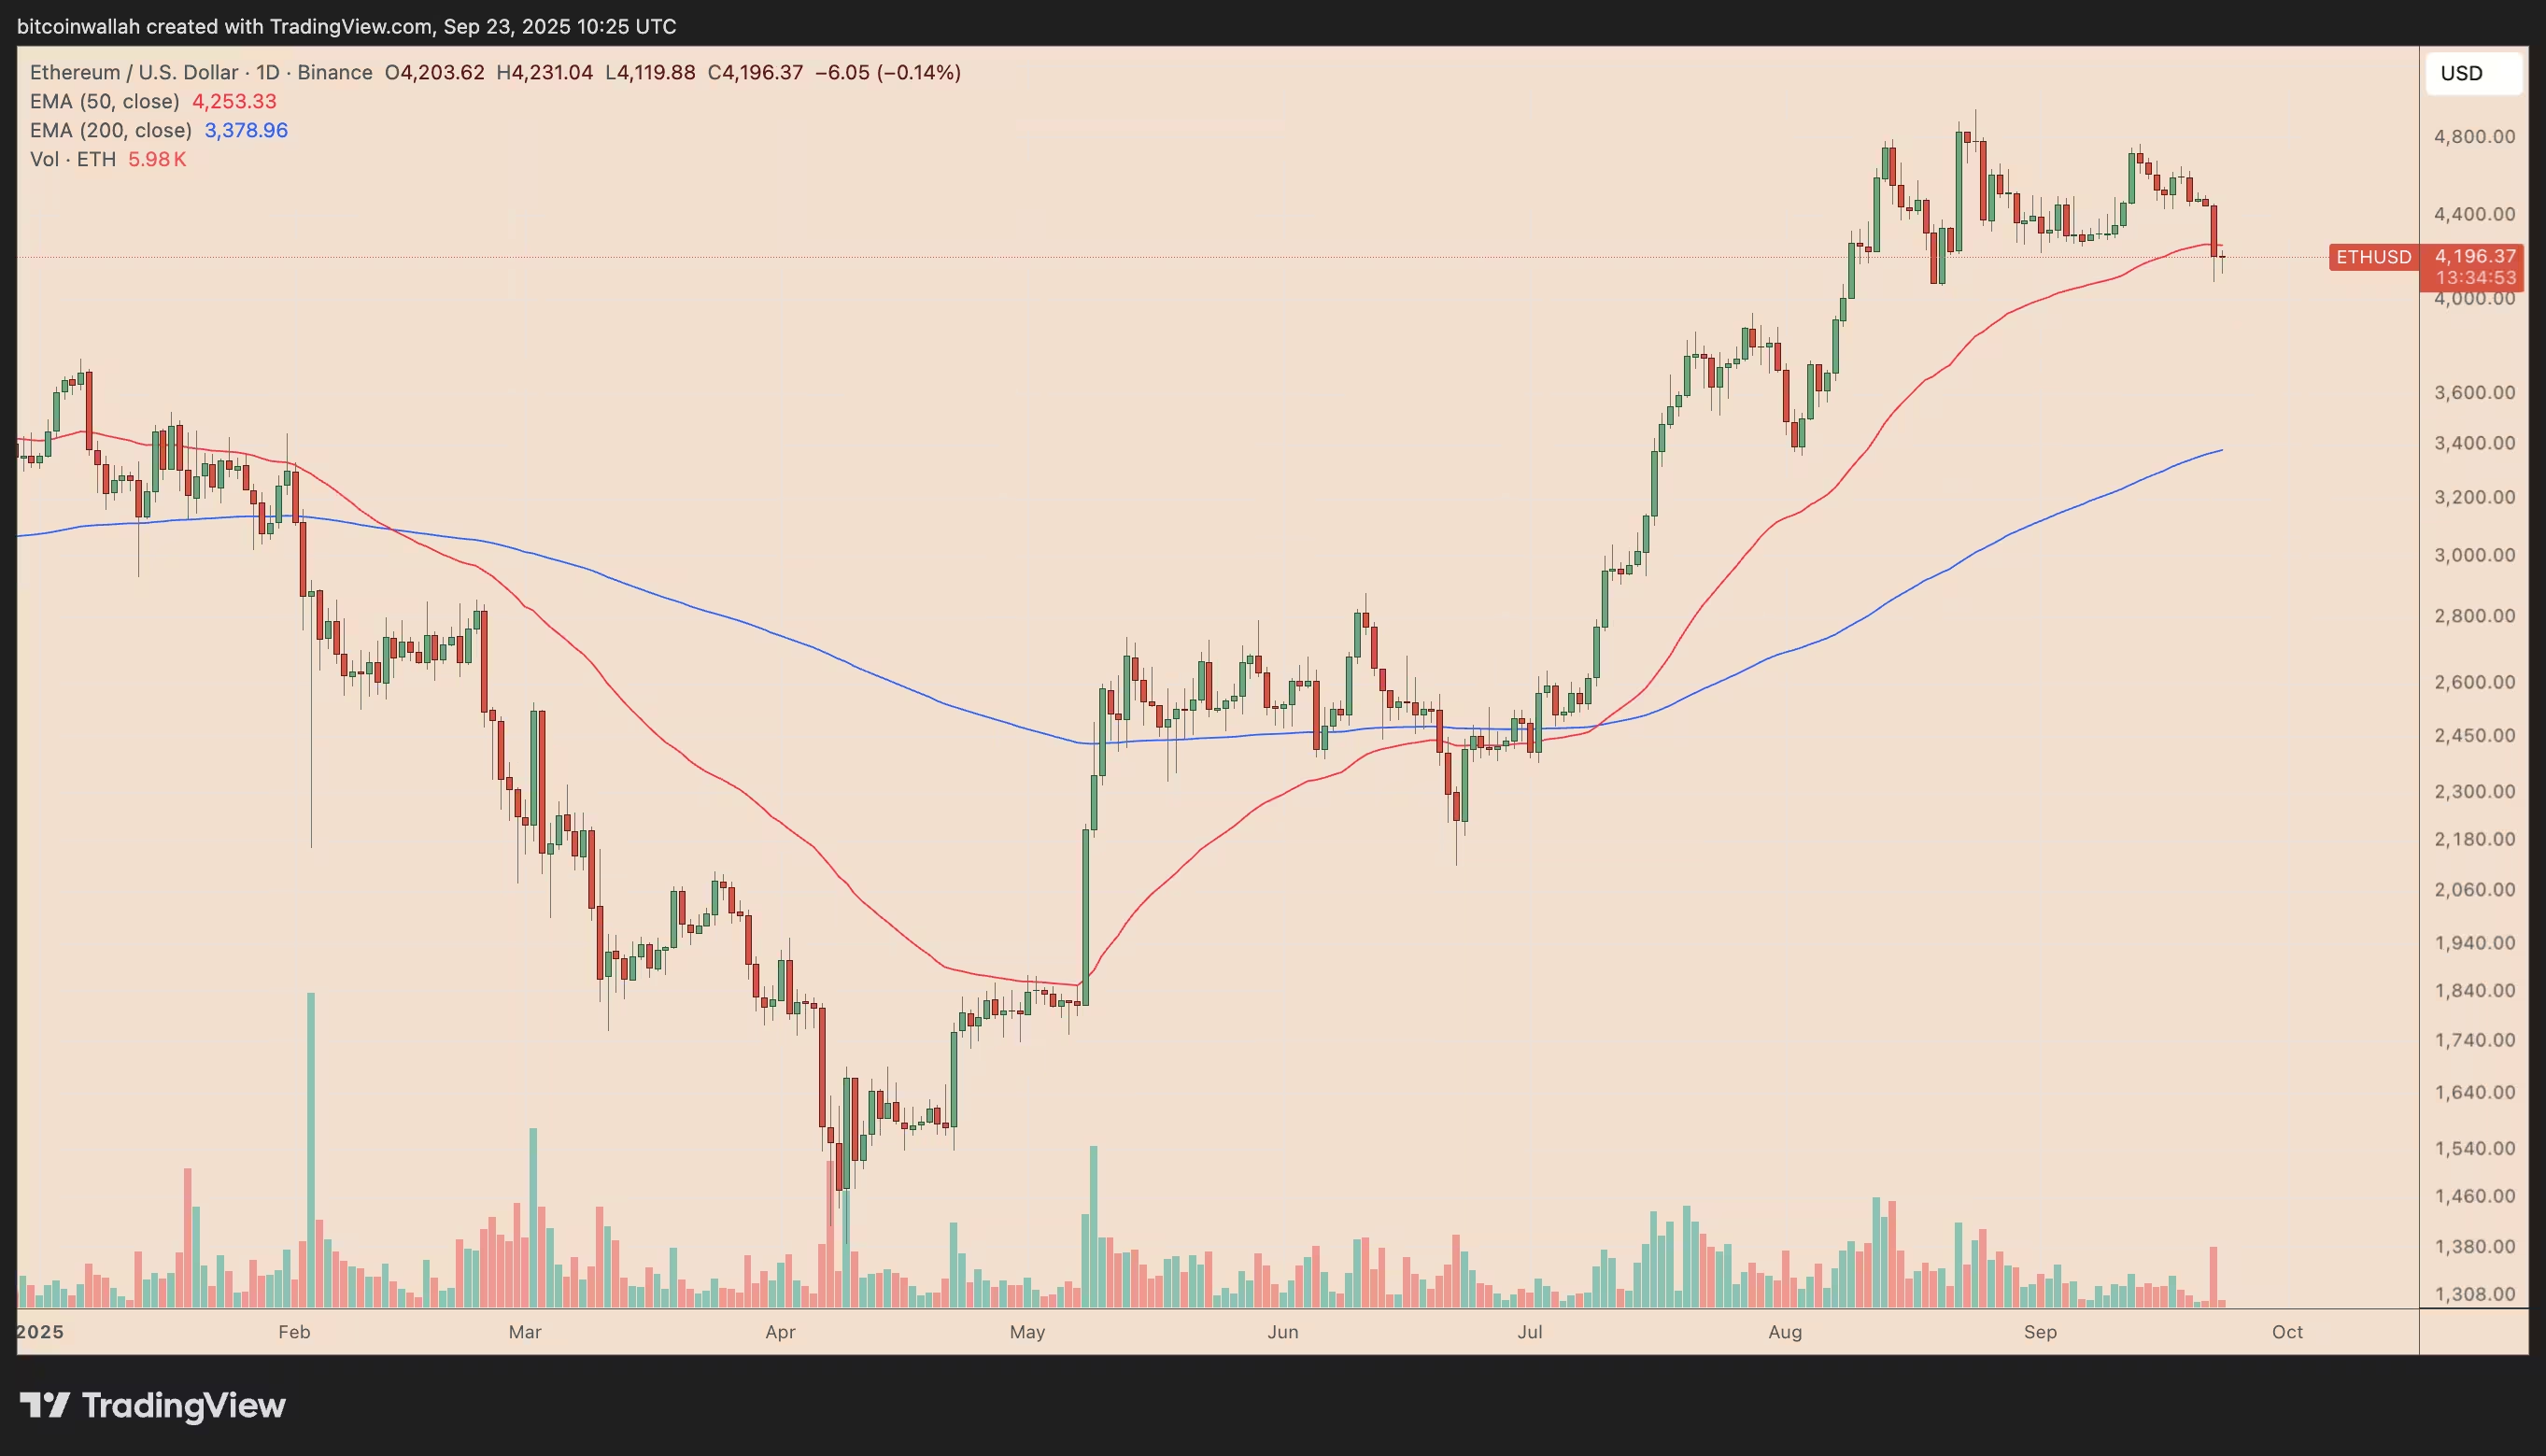
ETH/USD daily price chart
Why the triangle break matters
Symmetrical triangles typically resolve in the direction of the prior trend, but a downside breach often flips the pattern into a bearish reversal. If ETH sinks toward the $3,560 range it would align with support zones highlighted by market analysts and the 20-week exponential moving average, which some chartists use as a key mid-term trend gauge.
Support levels and the bulls’ defense line
Despite the triangle breakdown, Ether remains close to a rising trendline that has underpinned its uptrend since April. That same slope has historically preceded strong rebounds — in some cases fueling rallies of 90%–125% — so a decisive bounce here would improve the outlook for an extended recovery.
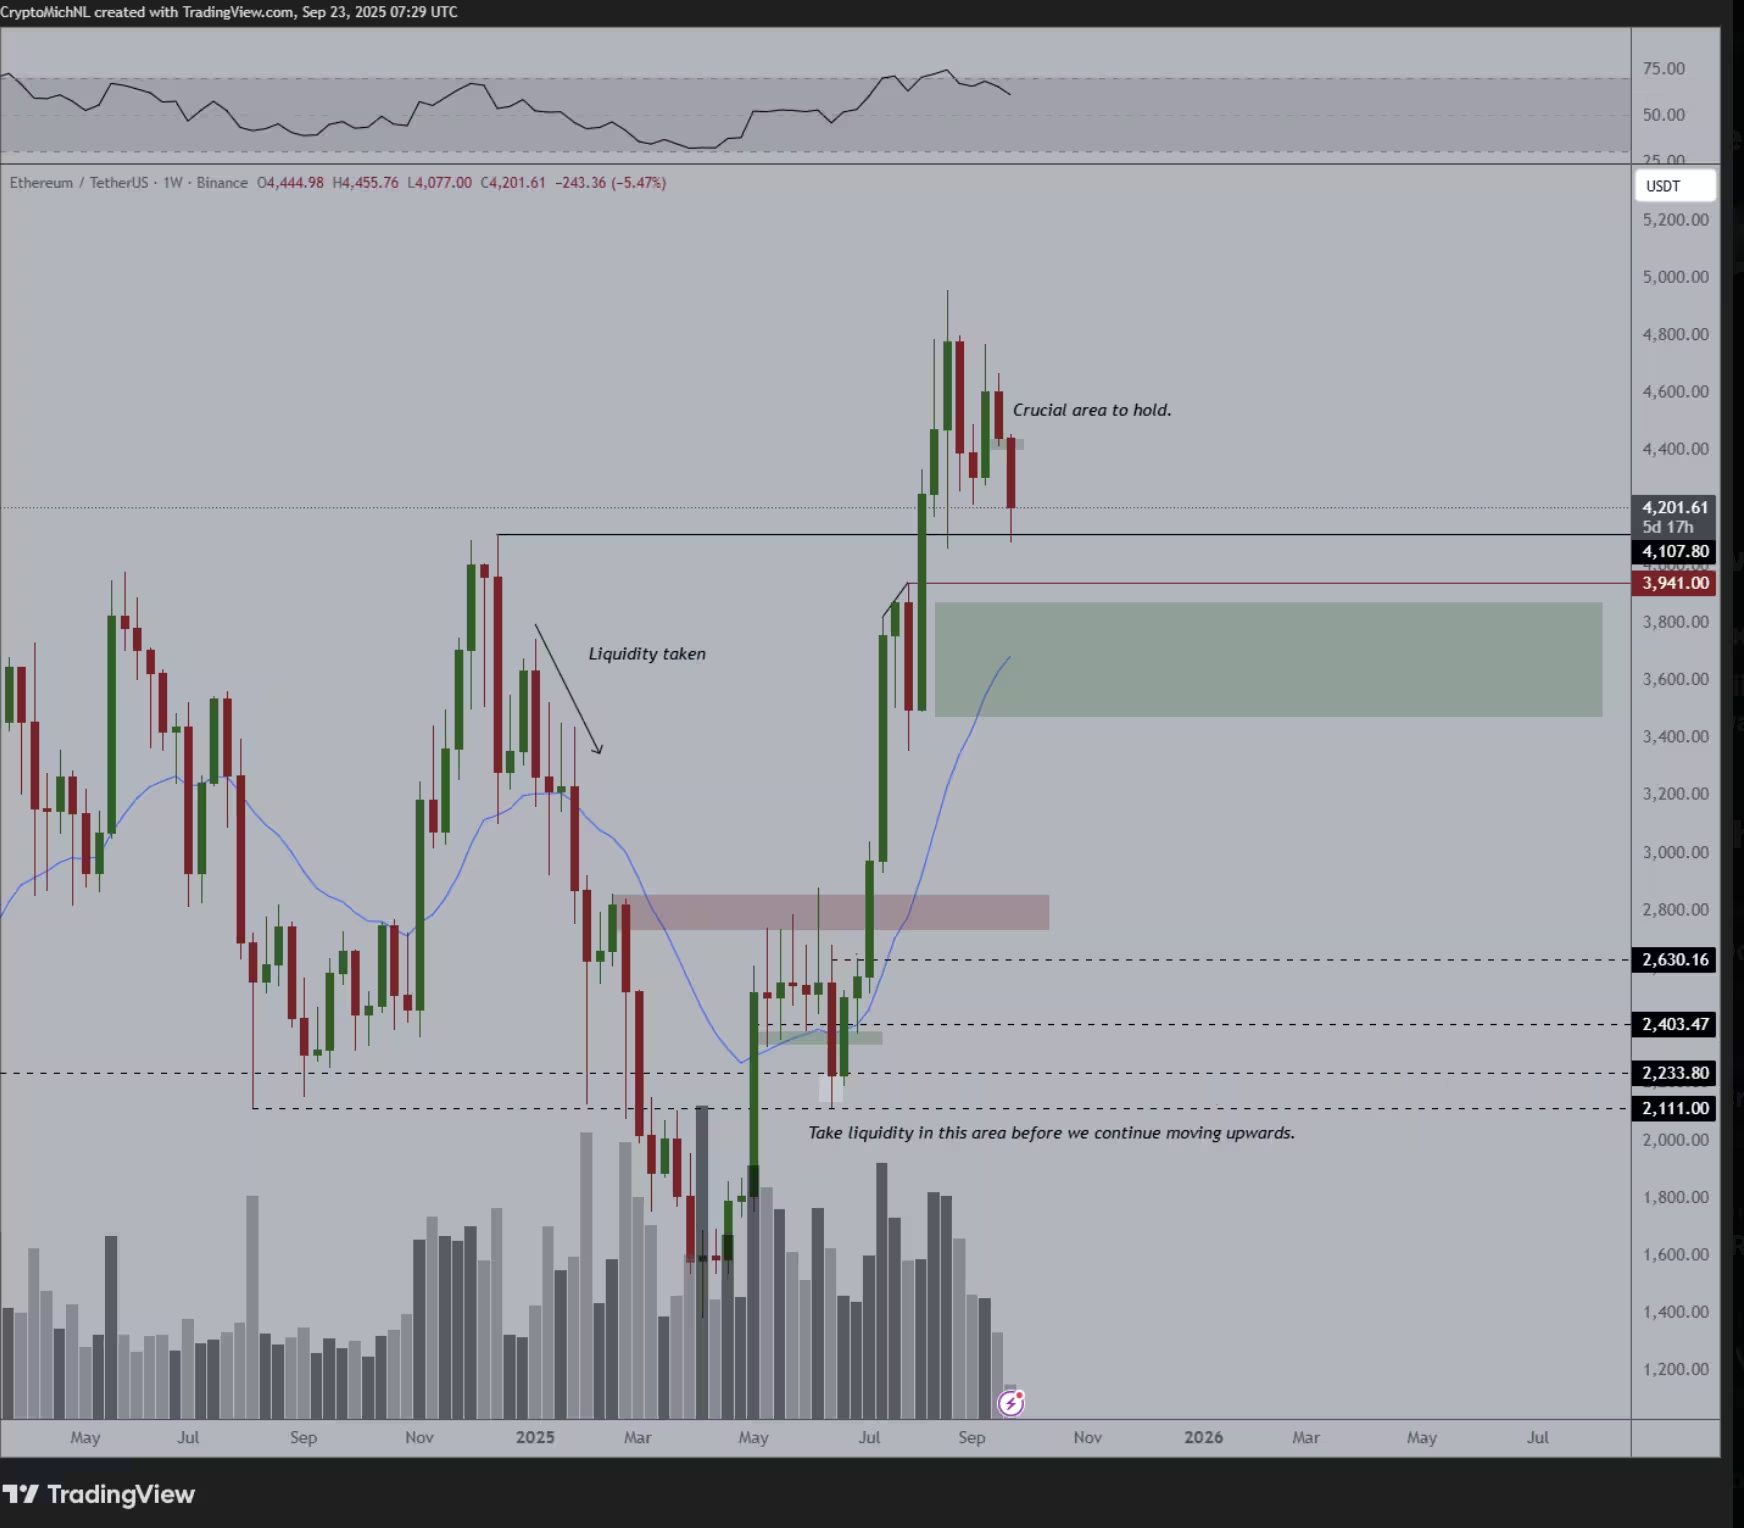
ETH/USD weekly price chart
Moving averages to watch
A clean close back above the 50-day exponential moving average (near $4,250) would be an encouraging sign for bulls, potentially setting up a run to the triangle’s upper boundary around $4,600–$4,700. Conversely, a failure to defend the rising trendline could open the door to the measured downside target and a deeper correction.
Bull case: Wyckoff setup and a path to $7,000
On the bullish side, a separate analysis using Wyckoff Accumulation principles suggests that Ethereum may have already completed key phases such as the spring and subsequent test earlier this year. From this perspective, the recent pullback can be read as a healthy retest — the Last Point of Support — that precedes a renewed markup phase.
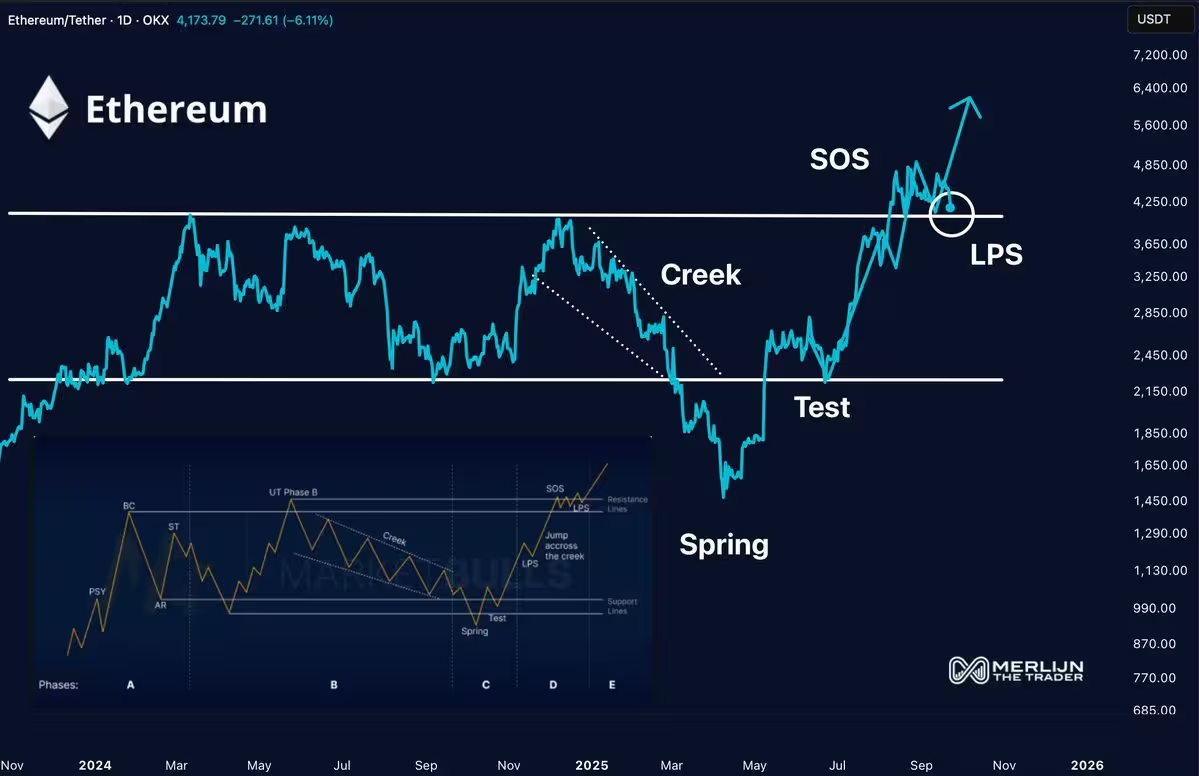
ETH/USD daily price chart
Potential upside and timeline
If the Wyckoff-based scenario validates and buying pressure resumes, ETH could target a breakout toward $7,000 in the longer term. That would represent gains of roughly 65% from current levels and echo bullish targets shared by several analysts across the space. Traders should still weigh risk-management rules given the near-term vulnerability highlighted by the triangle breakdown.
For active traders and investors, the immediate priorities are clear: monitor whether the ascending trendline around $4,000 holds, watch for a reclaim of the 50-day EMA, and follow volume and momentum for signs that the recent pullback is a retest rather than the start of a deeper correction. Proper position sizing and stop-loss planning remain essential in a market that can swing quickly.
Source: cointelegraph
Leave a Comment