
4 Minutes
Ethereum weekly MACD flashes bearish warning
Ether (ETH) has shown a bearish weekly MACD cross that historically preceded major declines, raising concern among traders and long-term investors. The moving average convergence divergence (MACD) — a core technical indicator for momentum and trend strength — recently moved toward a bearish crossover on the weekly timeframe, mirroring patterns seen during previous sharp selloffs.
Past MACD crosses on Ethereum's weekly chart coincided with dramatic drawdowns, including declines in the range of 46% to 60%. With ETH re-testing critical support levels in October, the technical setup suggests a higher probability of an extended retracement unless bulls defend key price floors.
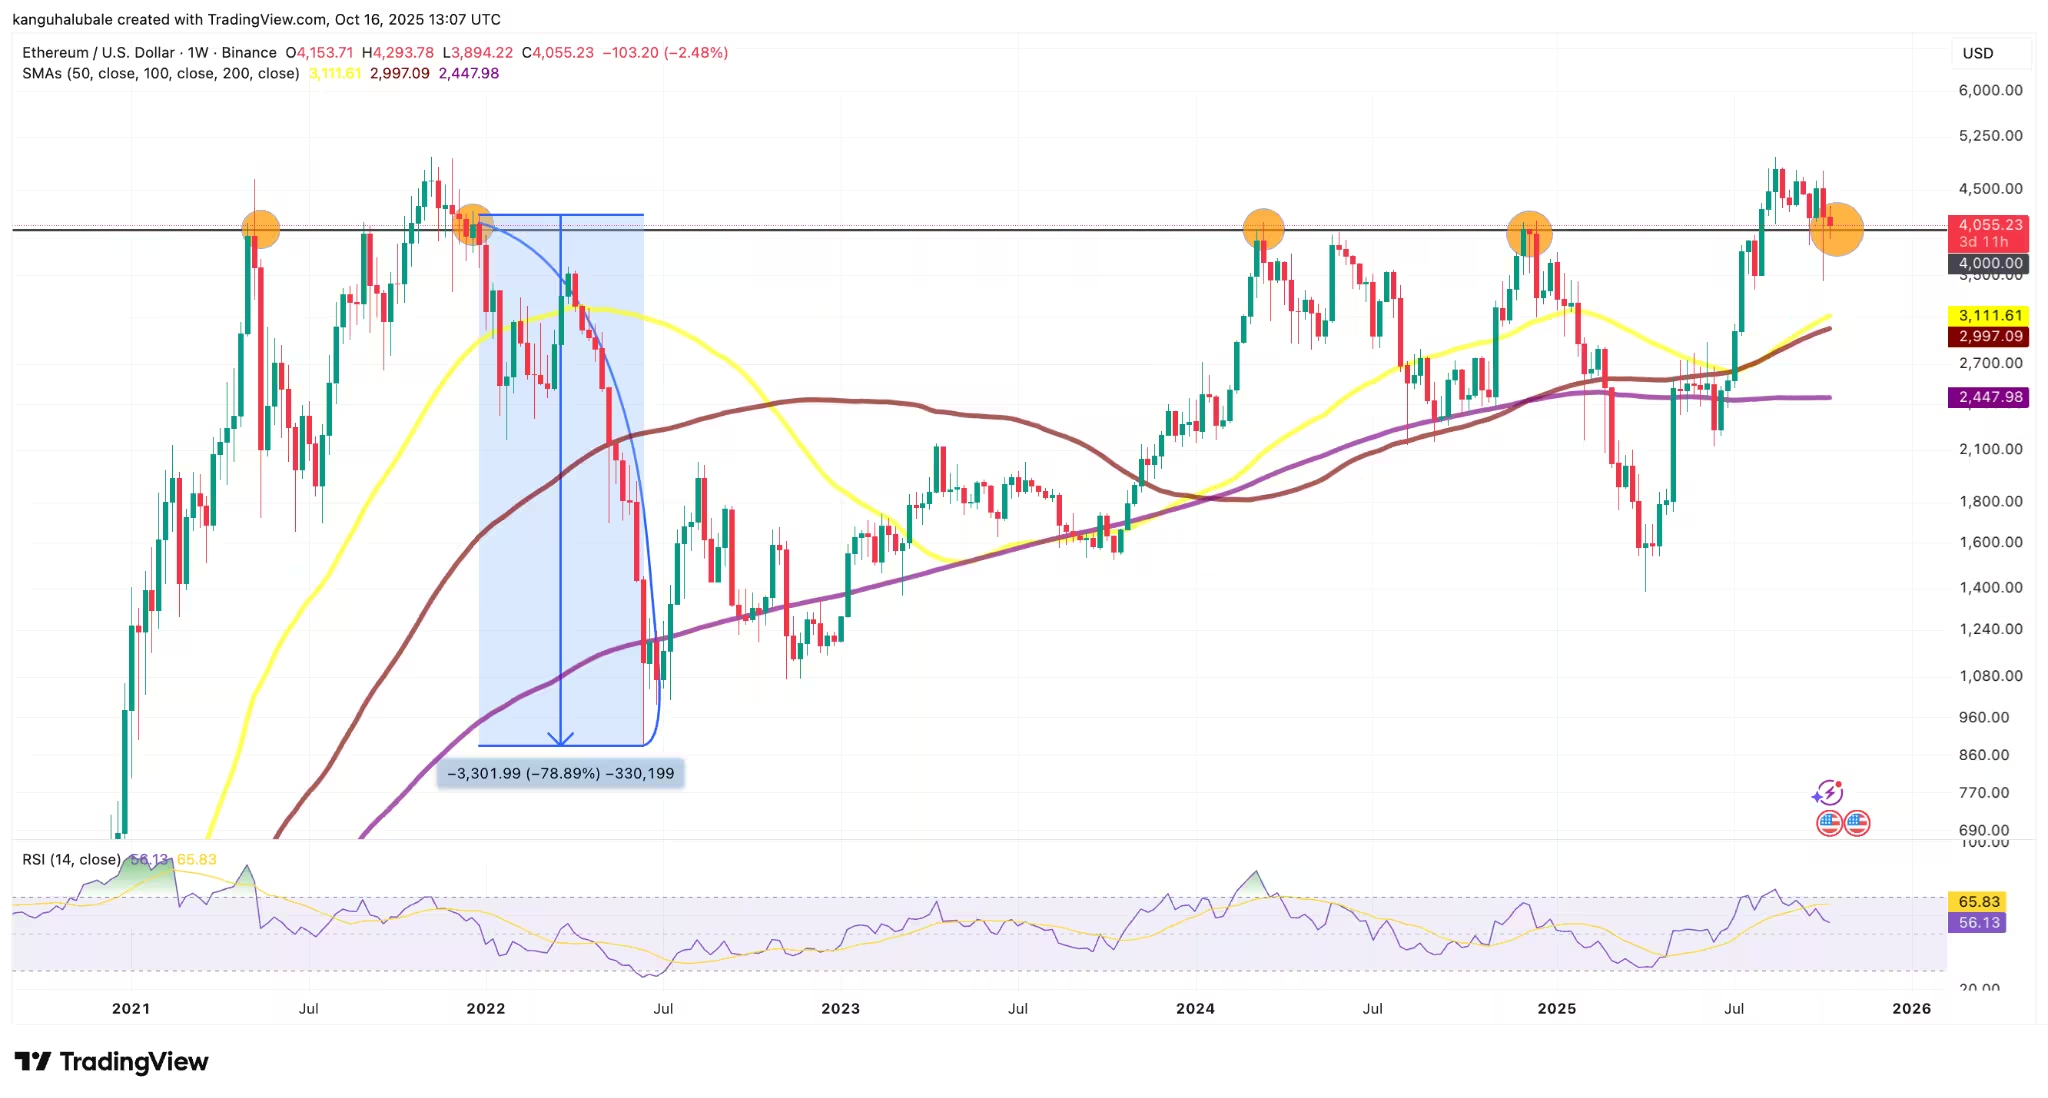
ETH/USD weekly chart. Source: Cointelegraph/TradingView
Traders use the MACD line, signal line, and histogram to gauge momentum shifts. When the MACD line crosses below the signal line on a weekly chart, it often signals a durable change in trend. For ETH, these weekly bearish crosses have previously led to fast, deep losses over weeks rather than mere intraday weakness.
Historical context: previous MACD crosses and deep corrections
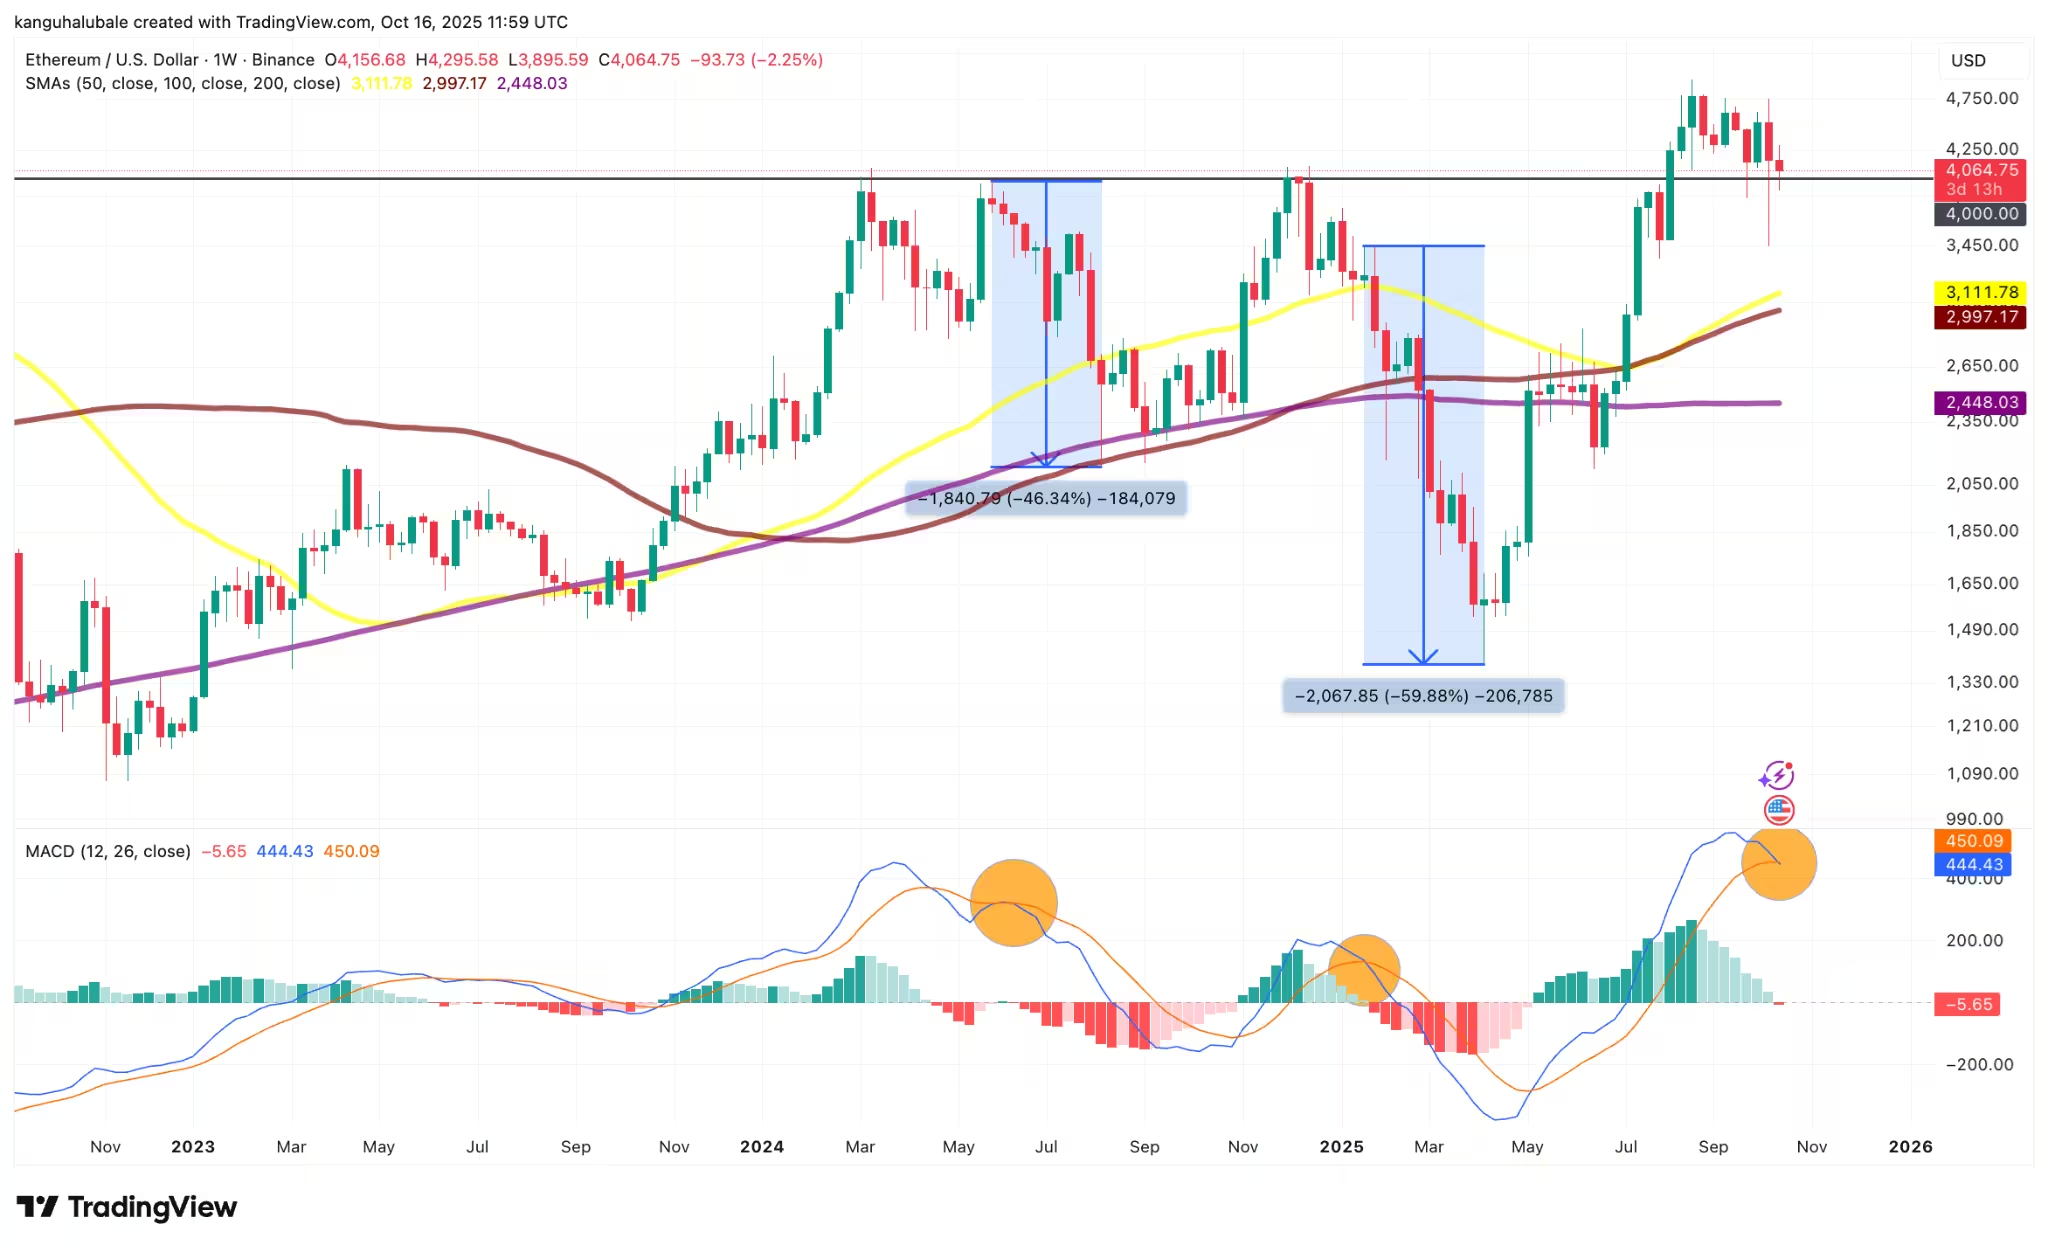
In recent cycles, similar weekly MACD bearish crosses preceded sizable retracements: mid-2024 saw ETH fall roughly 46% following a comparable signal, and early 2025 recorded a drop approaching 60% after another weekly bear cross. Those precedents are weighing on market sentiment as technical momentum weakens again.
Crypto analysts and traders on social platforms have flagged the current MACD behavior. Some recommend preparing for multiple scenarios — from prolonged sideways action to renewed selling pressure that targets lower support levels. The presence of a weekly bearish MACD cross does not guarantee a specific outcome, but it elevates downside risk in the near term.
ETH/USD weekly chart. Source: Cointelegraph/TradingView
Key support: why $4,000 matters for bulls
A pivotal level for Ethereum is the $4,000 support zone. ETH reclaimed and held this area earlier in the year, and a sustained break below it could open the door to larger corrections. Historical precedent underscores the importance of this floor: after losing a similar major support in late 2021, Ethereum endured a prolonged bear market that culminated in a roughly 78% decline into 2022.
Short- and medium-term traders are watching $3,899 to $4,200 as reference points. Analysts using Elliott Wave and other technical frameworks note that maintaining price above $3,899 keeps the bullish count viable, while a decisive breakdown could confirm a wider corrective phase.
Market reaction and trader positioning
On-chain buyers and institutions sometimes view dips as accumulation opportunities; some miners and entities have been observed adding to positions during pullbacks. However, bearish momentum can accelerate quickly if stop-loss clusters and margin liquidations are triggered near key support bands.
Market commentators advise risk management: tighten position sizing, use defined stop levels, and monitor higher-timeframe indicators like the weekly MACD. For investors focused on the long-term fundamentals of Ethereum — including upgrades, decentralized finance (DeFi) growth, and NFT activity — a pullback may present buying opportunities. For traders, the priority remains to respect trend signals and price structure.
What to watch next
Watch for a confirmed weekly close with the MACD cross completed, and observe whether ETH can hold above $4,000. A failure to defend that area would likely put further downside targets in play, while a rebound and re-acceleration above recent range highs would suggest momentum has returned to the bulls. Keeping an eye on liquidity bands, on-chain flows, and macro risk sentiment will also help interpret the MACD signal in context.
Source: cointelegraph
Leave a Comment