
4 Minutes
Bitcoin drifts near $89,000 as ETF flows weaken
Bitcoin traded close to the $89,000 level on Monday as demand for spot Bitcoin exchange-traded funds (ETFs) cooled. Institutional flows into the primary spot ETF products cooled sharply over the past week, signaling diminished interest from large-scale investors and weighing on BTC momentum.
Weekly ETF outflows paint a worrying picture
Data from SoSoValue shows the 12 major spot Bitcoin ETFs posted $497.05 million in combined net outflows for the week of Dec. 15–19. BlackRock’s IBIT led redemptions, with $240.3 million exiting the fund. Bitwise’s BITB and ARK 21Shares’ ARKB followed, reporting $115.1 million and $100.7 million in net outflows, respectively. VanEck’s HODL plus Grayscale’s GBTC and BTC funds added another $74.1 million of outflows, while Fidelity’s FBTC bucked the trend with $33.1 million in inflows.
These weekly outflows are part of a broader pattern: the spot ETF suite has now recorded roughly $3.5 billion in net outflows over the past month. That stands in stark contrast to the inflows seen in October, when these funds attracted nearly $7 billion as Bitcoin surged to new highs. The shift highlights how institutional appetite can reverse quickly and how ETF flows increasingly influence BTC price action.
Market context: thin liquidity and macro watch
Beyond ETF flows, price behavior has been muted by thin holiday liquidity and ongoing macroeconomic uncertainty. Traders are cautious ahead of several key U.S. data releases — notably GDP and jobless claims — which are scheduled for Thursday, Dec. 25. Those releases could act as catalysts for risk appetite, influencing crypto markets alongside equities and bonds.
Bitcoin slipped about 6% from near $90,000 to a weekly low of $84,580 on Friday, then partially recovered to roughly $89,800 before retreating to near $89,100 at press time. Over the last 24 hours, BTC was essentially flat, up around 1% as buyers and sellers remain balanced in low-volume conditions.
Technical setup: multiple bearish patterns
Bitcoin’s daily chart shows a cluster of bearish technical signals that historically precede deeper pullbacks. Price action has formed a bearish flag since late October. At the time of writing, BTC was approaching the lower trendline of that flag — a potential signal that a downside break is imminent.
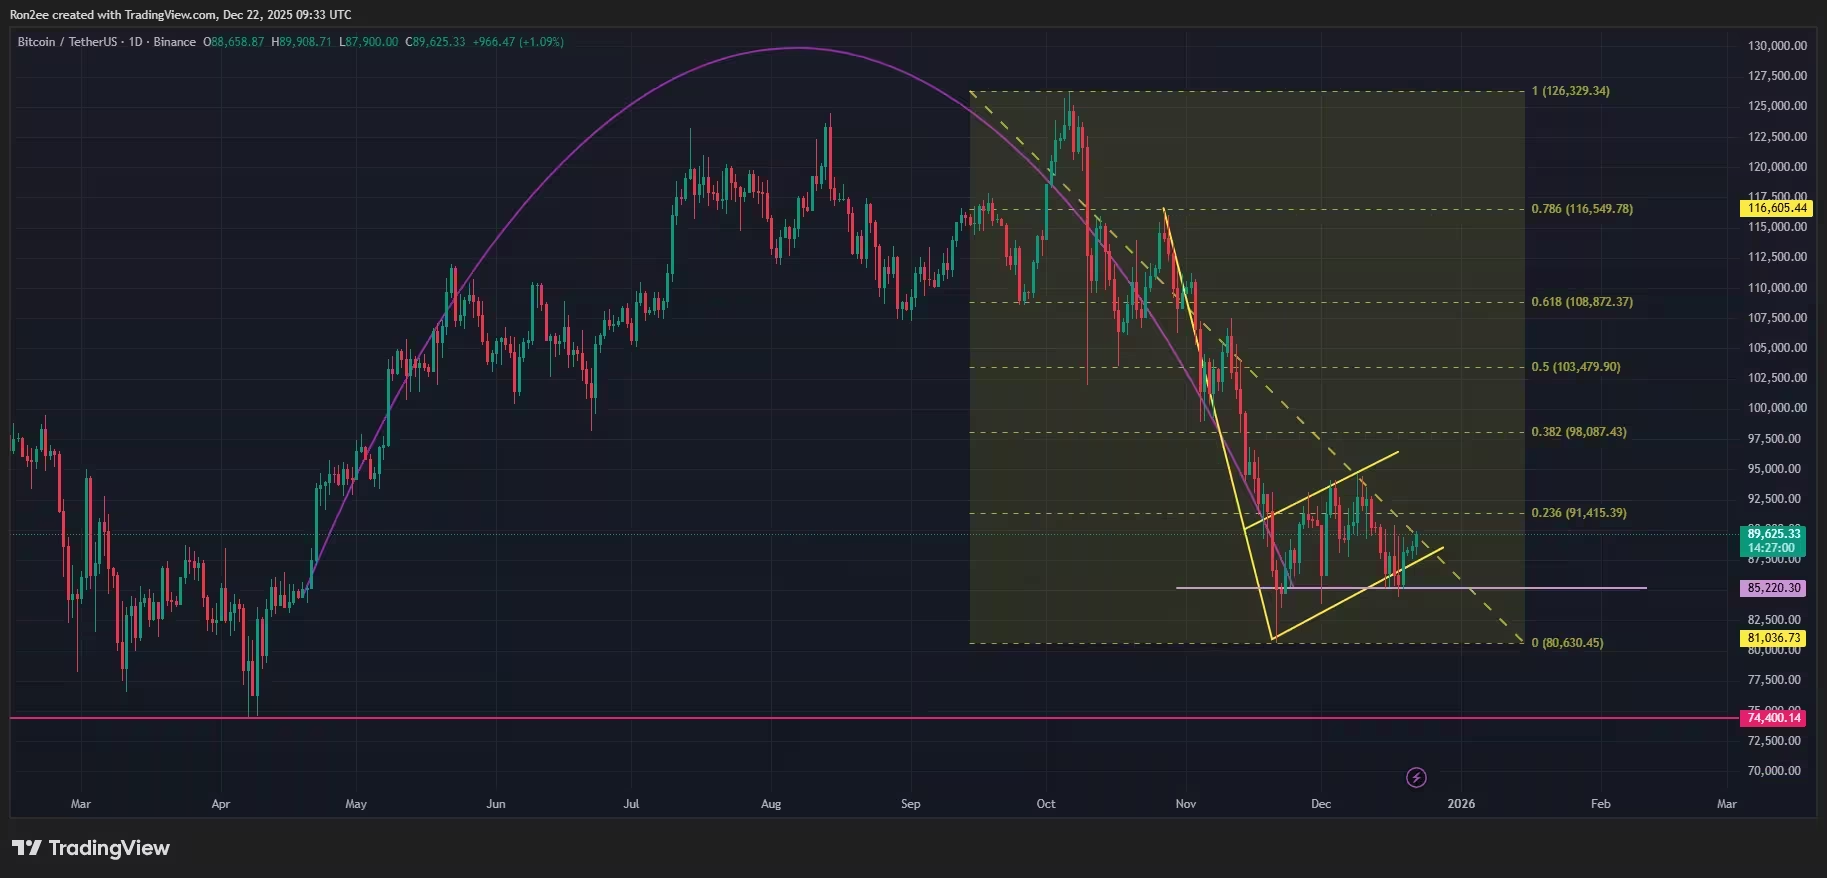
Bitcoin price has formed multiple bearish patterns on the daily chart — Dec. 22
A decisive break below the flag’s lower boundary would also likely confirm a breakdown from a larger inverse cup-and-handle structure noted by chart analysts. With both patterns aligned bearish, the short-term outlook leans toward downside pressure unless a clear reversal or fresh inflows surface.
Key levels traders are watching
- Immediate support: $85,220 — this level has acted as a price floor where bulls previously defended losses.
- Psychological support: $80,000 — a breach here would increase downside momentum.
- Key resistance: $91,415 — aligns with the 23.6% Fibonacci retracement measured from the October all-time high to November’s sharp pullback; a break above this level would be needed for a sustained recovery.
What could change the narrative?
Several factors could reverse the current bearish bias. Renewed ETF inflows, improved liquidity after the holidays, or better-than-expected macro prints could draw buyers back into Bitcoin. Conversely, continued outflows or a breakdown below the $85,220 support could push BTC toward $80,000 and amplify negative sentiment.
For now, traders and crypto investors are keeping a close eye on ETF flow reports, macroeconomic data, and technical confirmation signals. Given Bitcoin’s growing correlation with institutional instruments like spot ETFs, monitoring fund flows has become essential for gauging near-term price direction in the crypto market.
Source: crypto
Leave a Comment