
3 Minutes
Altcoin Season Index slides as Bitcoin dominance strengthens
The Altcoin Season Index has weakened sharply, driven by a renewed rise in Bitcoin dominance and a broad sell-off across alternative cryptocurrencies. The index — which measures how altcoins perform versus Bitcoin (BTC) — fell to 15, its lowest reading this year, as most tokens traded lower over recent weeks.
Altcoins' aggregate market capitalization has contracted materially, and price action suggests the market faces renewed downside pressure. Data from CoinMarketCap highlights that only a handful of projects posted gains over the last 90 days, while many tokens suffered steep losses amid reduced risk appetite and ongoing deleveraging.
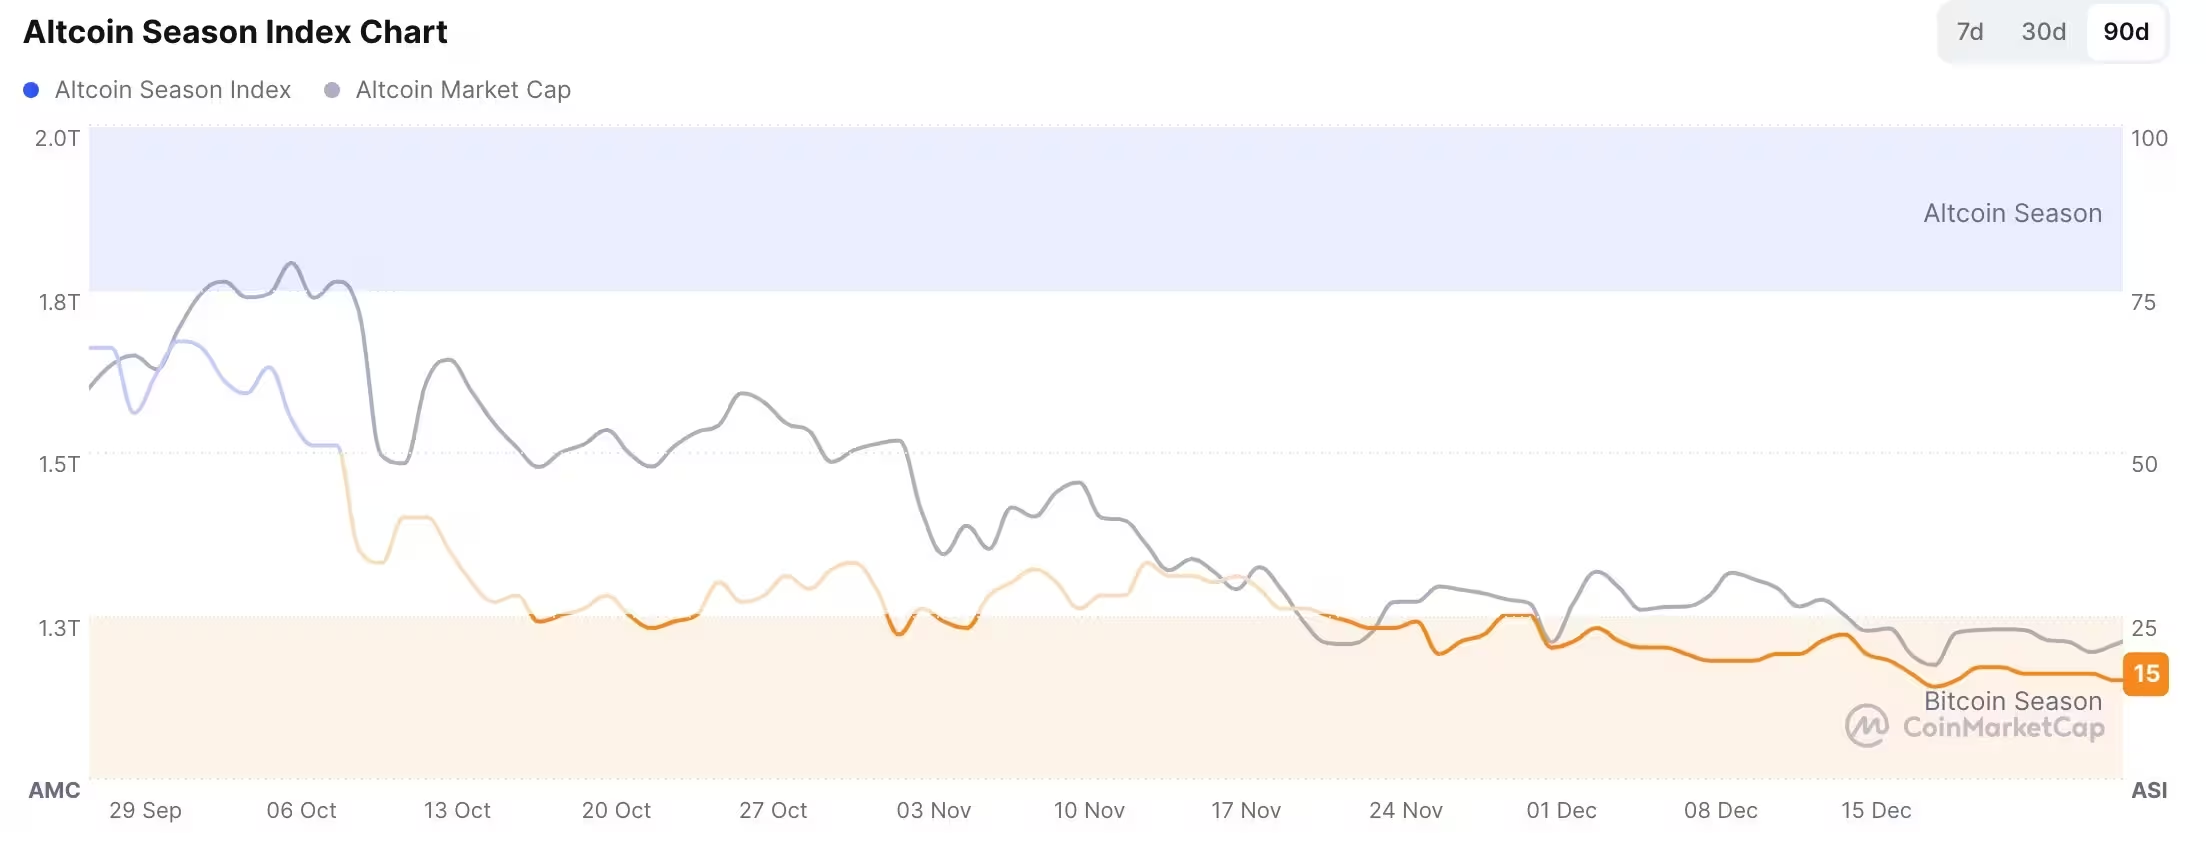
Altcoin Season Index chart
Winners, losers and market sentiment
Among notable outperformers, Pippin surged more than 2,300%, while privacy-focused projects such as Zcash, Dash, Monero and Merlin Chain also posted positive returns. In contrast, names like DoubleZero, Story, MYX Finance, Immutable and Pudgy Penguins were among the biggest underperformers, each falling by more than 60% in the same 90-day window.
Sentiment indicators corroborate the caution: the Crypto Fear and Greed Index has tumbled into the fear zone around 25, and open interest has declined as traders trimmed leverage. The sell-off accelerated after the October 10 event, when more than 1.6 million traders were impacted by a roughly $20 billion liquidation, prompting sustained risk aversion and lower demand for altcoins.
Why Bitcoin's strength matters for altcoins
Historically, altcoins tend to underperform during periods of Bitcoin strength or sharp BTC declines — altcoins often see steeper drops when BTC volatility spikes. The recent shift toward Bitcoin has contributed to the Altcoin Season Index's slide as investors prioritize perceived safety and liquidity in BTC over smaller-cap tokens.
Technical backdrop: double-top and moving averages
On the three-day chart, the combined market capitalization of tokens excluding Bitcoin and Ethereum fell from around $1.19 trillion in October to about $825 billion today. Price action shows a double-top formation near $1.16 trillion, with a neckline positioned around $658 billion — a pattern that historically raises the probability of deeper declines if the neckline is tested.
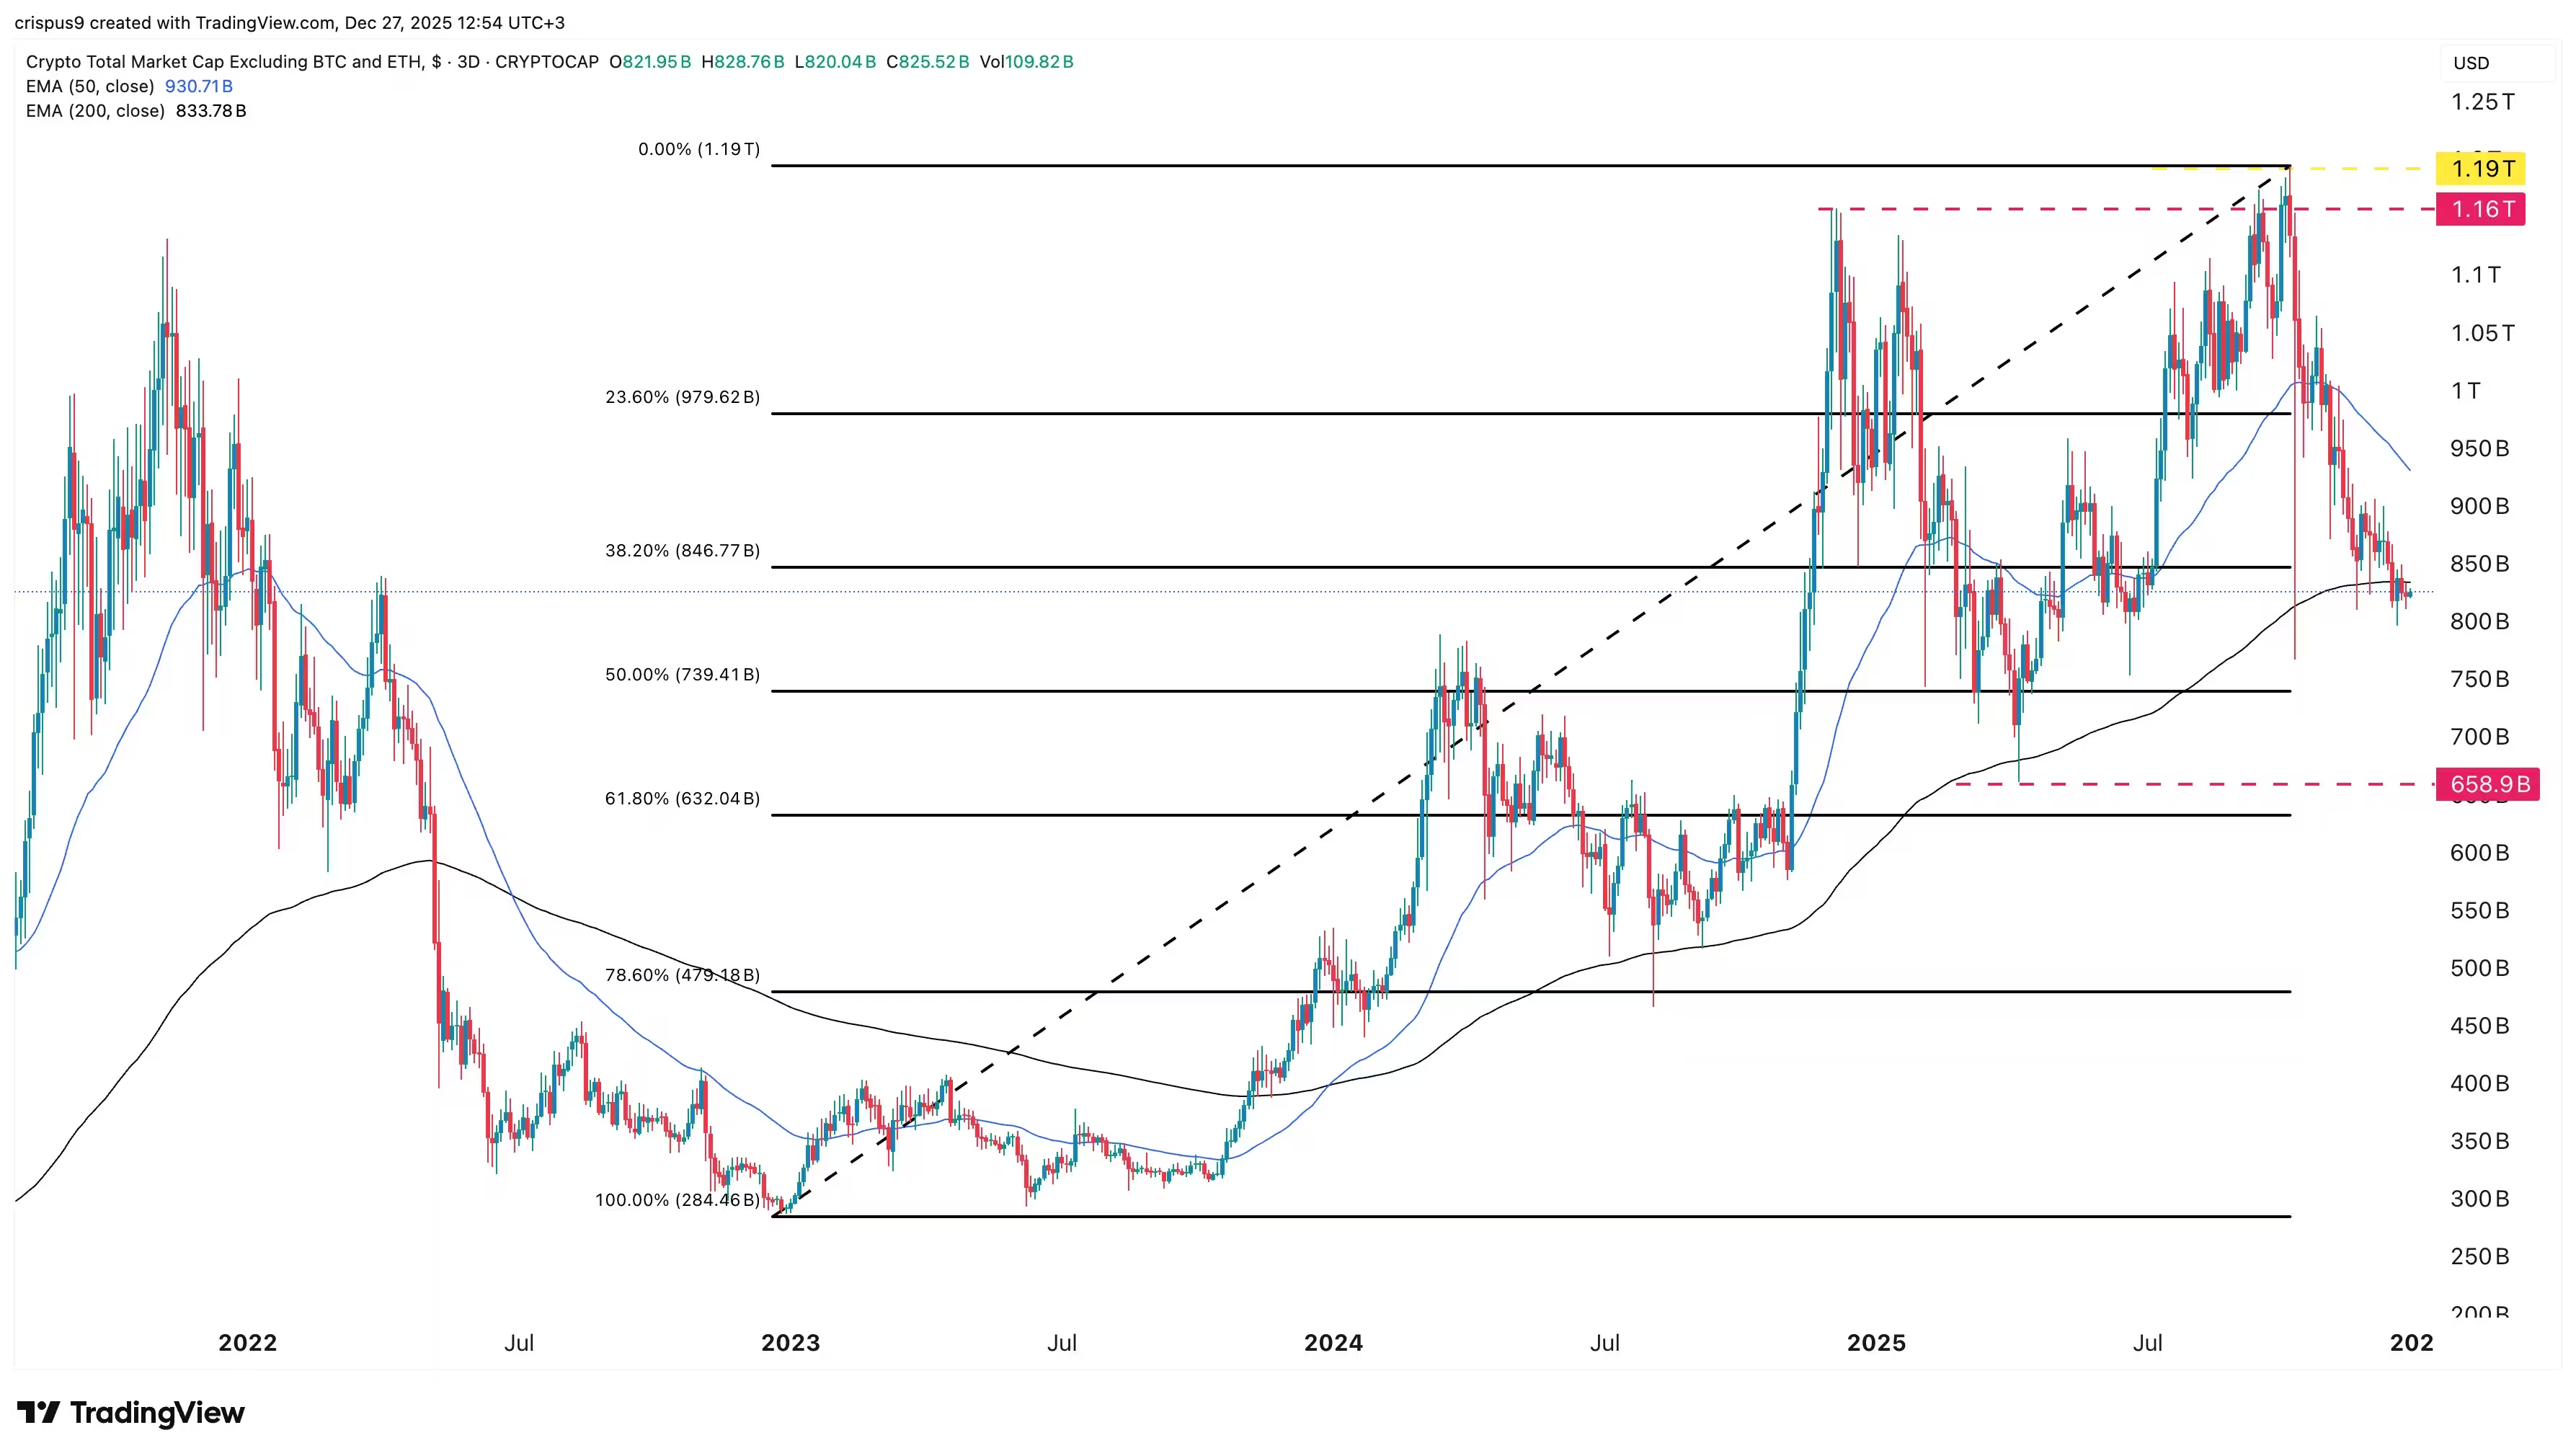
Altcoin Season Index chart
Indicator breakdown and downside targets
Technically, the market cap has slipped below both the 50-day and 200-day exponential moving averages, signaling that bears retain control. Momentum metrics such as the Relative Strength Index (RSI) and MACD have also trended lower over recent months. The market currently faces an initial retracement target near the 50% Fibonacci level at roughly $739 billion; a sustained break below that level could accelerate selling toward the $658 billion neckline.
For traders and investors, the immediate takeaway is to monitor Bitcoin dominance, open interest, and key technical levels on altcoin market capitalization. Risk management and position sizing remain critical while the market digests reduced leverage and persistent bearish technical signals.
Source: crypto
Leave a Comment