
4 Minutes
The non-fungible token (NFT) ecosystem saw a dramatic rise in supply in 2025 while total sales and average prices declined, signaling a shift to a high-volume, low-price market. As minting tools and cross-chain platforms made it cheaper and easier to create NFTs, creators flooded the market even as buyer spending cooled.
Market overview: supply growth outpaces buyer demand
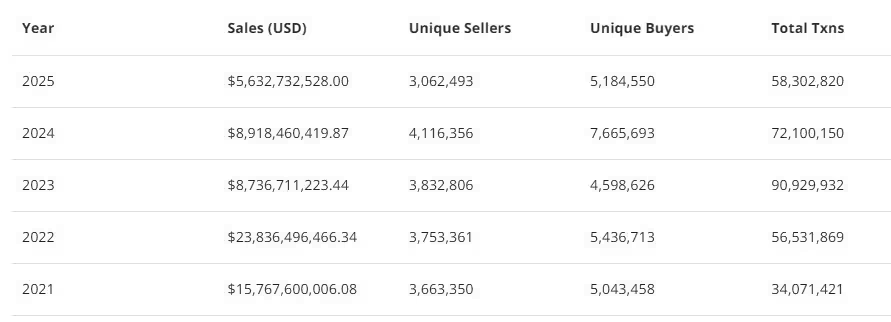
CryptoSlam data indicates the total NFT supply climbed to roughly 1.34 billion tokens this year, up about 25% from the one billion tokens recorded in 2024. At the same time, total NFT sales fell to approximately $5.63 billion in 2025 — a 37% decline from the $8.9 billion in 2024. Average sale prices dropped year-on-year to $96, down from $124 the prior year.
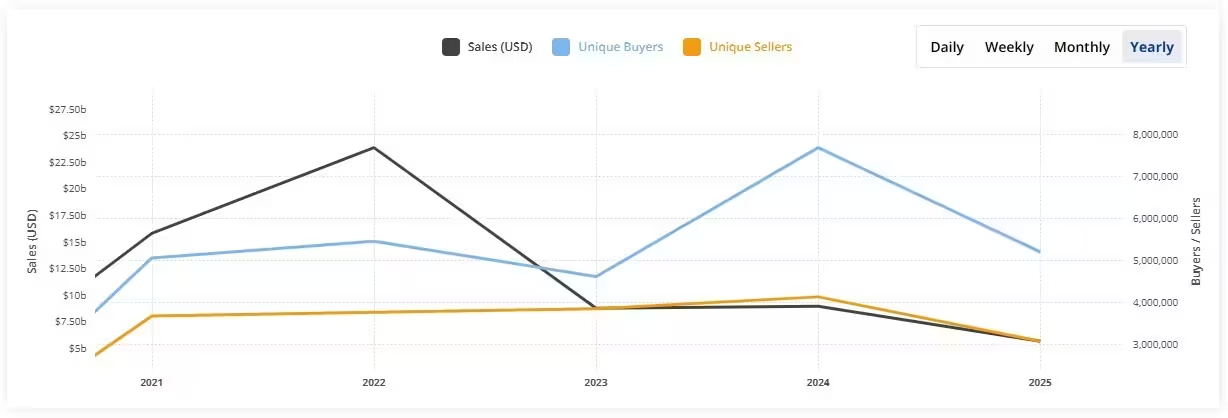
NFT sales, buyers, and sellers chart
This divergence — surging supply with shrinking sales and ticket sizes — highlights a market where liquidity is spreading across many more assets. NFT minting accelerated, yet buyer participation and spending failed to scale with production, reducing per-item demand and pressuring prices.
Supply expansion: four-year growth trajectory
Between 2021 and 2025 the NFT supply expanded rapidly. CryptoSlam shows a rise from 38 million tokens in 2021 to over 106 million in 2022. Production accelerated after that, surpassing 550 million in 2023 and nearly doubling to 1 billion in 2024. The 1.34 billion figure in 2025 represents roughly a 35-fold increase over four years — about 3,400% growth.
NFT sales volume from 2021 to 2025
Lower minting costs, simplified minting interfaces, and new blockchain venues contributed to this supply surge. But greater output did not translate into proportionate buyer growth, pushing many projects to compete more fiercely for collector attention.
Sales, pricing and liquidity pressures
The NFT market peaked in terms of sales volume in 2022 and has trended downward since. Average sale values, which topped near $400 during the 2021–2022 boom, fell below $100 in 2025. This shrinking average sale price, combined with fewer dollars changing hands overall, points to thinner liquidity and more price-sensitive buying behavior across marketplaces.
For creators and platforms, the result is a crowded landscape where discoverability and utility play larger roles. Projects emphasizing utility, community, or cultural relevance have a better chance of standing out as speculative demand wanes.
Market capitalization trends and implications
Total NFT market capitalization has contracted sharply since an April 2022 peak of about $17 billion. After a partial recovery to $10.8 billion in December 2024, the cap fell again through 2025 and closed the year near $2.4 billion.
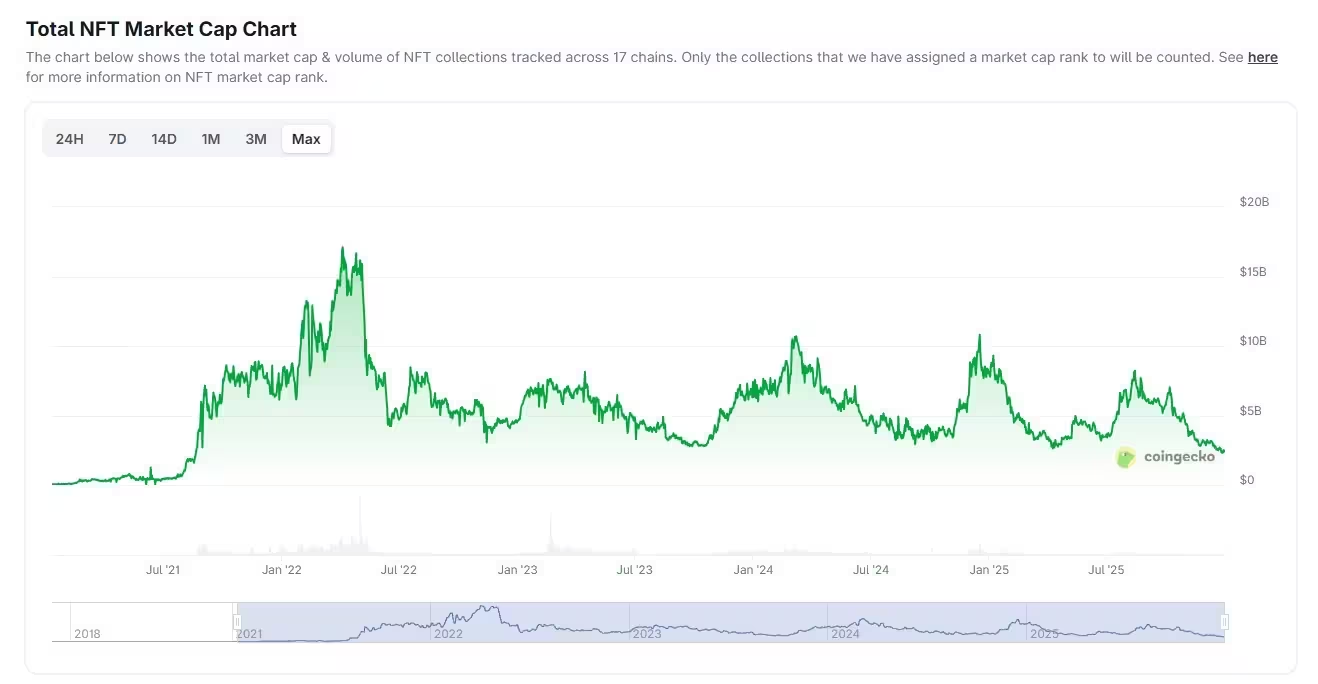
Total NFT market cap chart
The persistent decline in market cap reflects lower floor prices, reduced trading volumes, and diluted liquidity amid rising token counts. For collectors, investors, and builders, 2025 confirmed a structural shift: the NFT market is moving toward high volume and low price dynamics, elevating the importance of utility, curation, and smarter distribution strategies.
What to watch in 2026
Expect continued emphasis on NFTs with utility (access, royalties, token-gated services) and stronger community engagement. Market consolidation among platforms and tools that improve discoverability and on-chain interoperability could help rebalance supply and demand over time.
Source: cointelegraph
Leave a Comment