
3 Minutes
Solana price prediction as network metrics accelerate
Solana (SOL) has retreated from recent highs, but on-chain data paints a much stronger picture for the network’s fundamentals. Despite SOL slipping to around $126—its lowest since January 2—it remains supported by robust transaction growth, rising network fees, and expanding user adoption that together point to a potential near-term recovery.
On-chain activity: transactions, users and fees climb
Analytics from Nansen show Solana processed more than 2 billion transactions in the last 30 days, outpacing many other leading layer-1 and layer-2 chains by a wide margin. Active addresses surged 34% over the same period to about 81.2 million, while total network fees increased roughly 42% to exceed $20 million. These metrics indicate sustained real-world usage across DeFi, NFT, and payments flows.
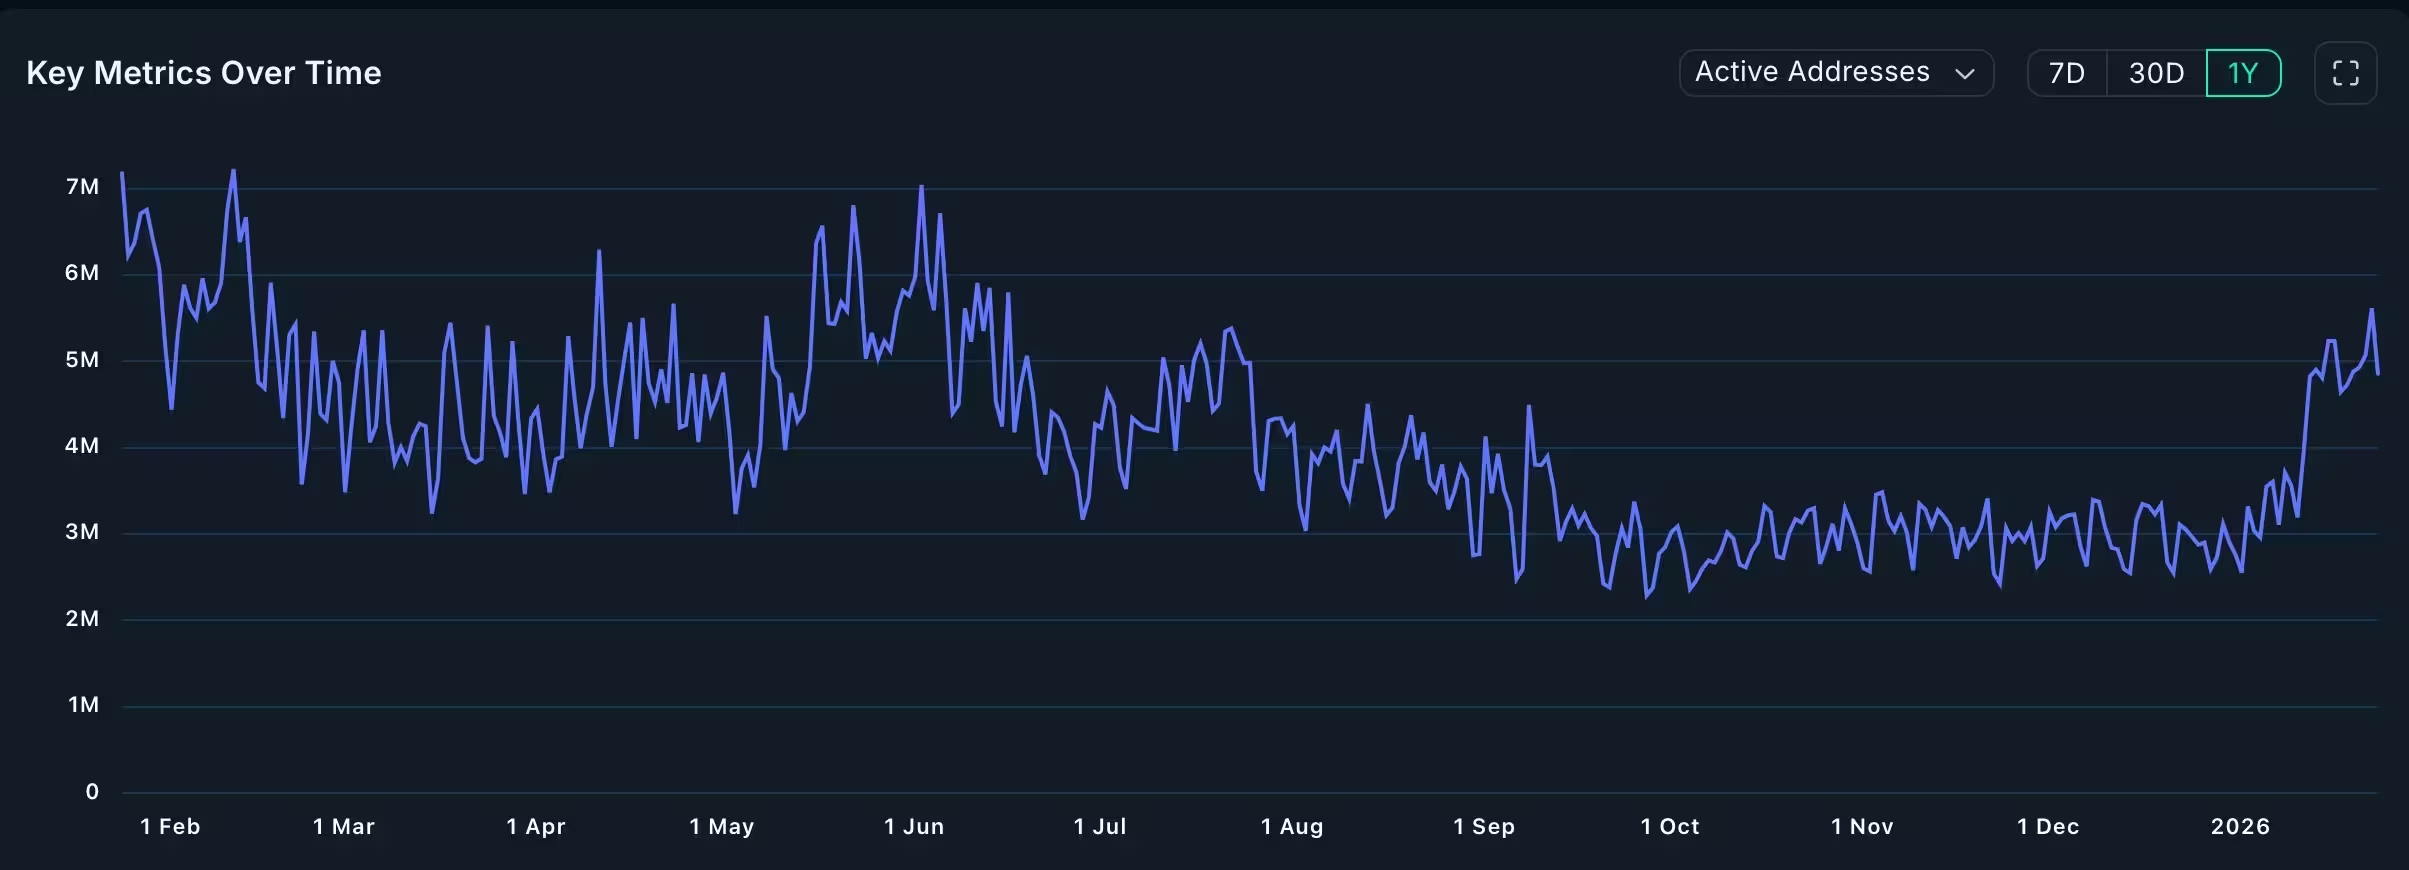
Solana active addresses
Decentralized exchange (DEX) volume on Solana also remained strong: DEX protocols handled over $107 billion in trading volume—higher than several competing networks combined—while stablecoin transfer volume topped $312 billion with roughly 260 million transactions. There are now more than 4.5 million stablecoin addresses in the Solana ecosystem, reflecting heavy on-chain stablecoin activity that often underpins broad crypto adoption.
Why adoption matters for SOL price
Network usage and fee accrual are key drivers for token demand and long-term value capture. Higher transaction counts and fee revenue can attract developers and liquidity, while strong DEX and stablecoin volumes reinforce Solana’s position as a high-throughput chain for payments and trading. The growing user base and workload also increase the economic relevance of SOL for staking, fees, and governance.
Technical outlook: charts point to possible rebound
From a technical perspective, SOL has pulled back from a year-to-date high near $148 to around $126. On daily charts, traders have identified bullish formations—including an inverted head-and-shoulders and a cup-and-handle—that often precede recoveries if key support levels hold.
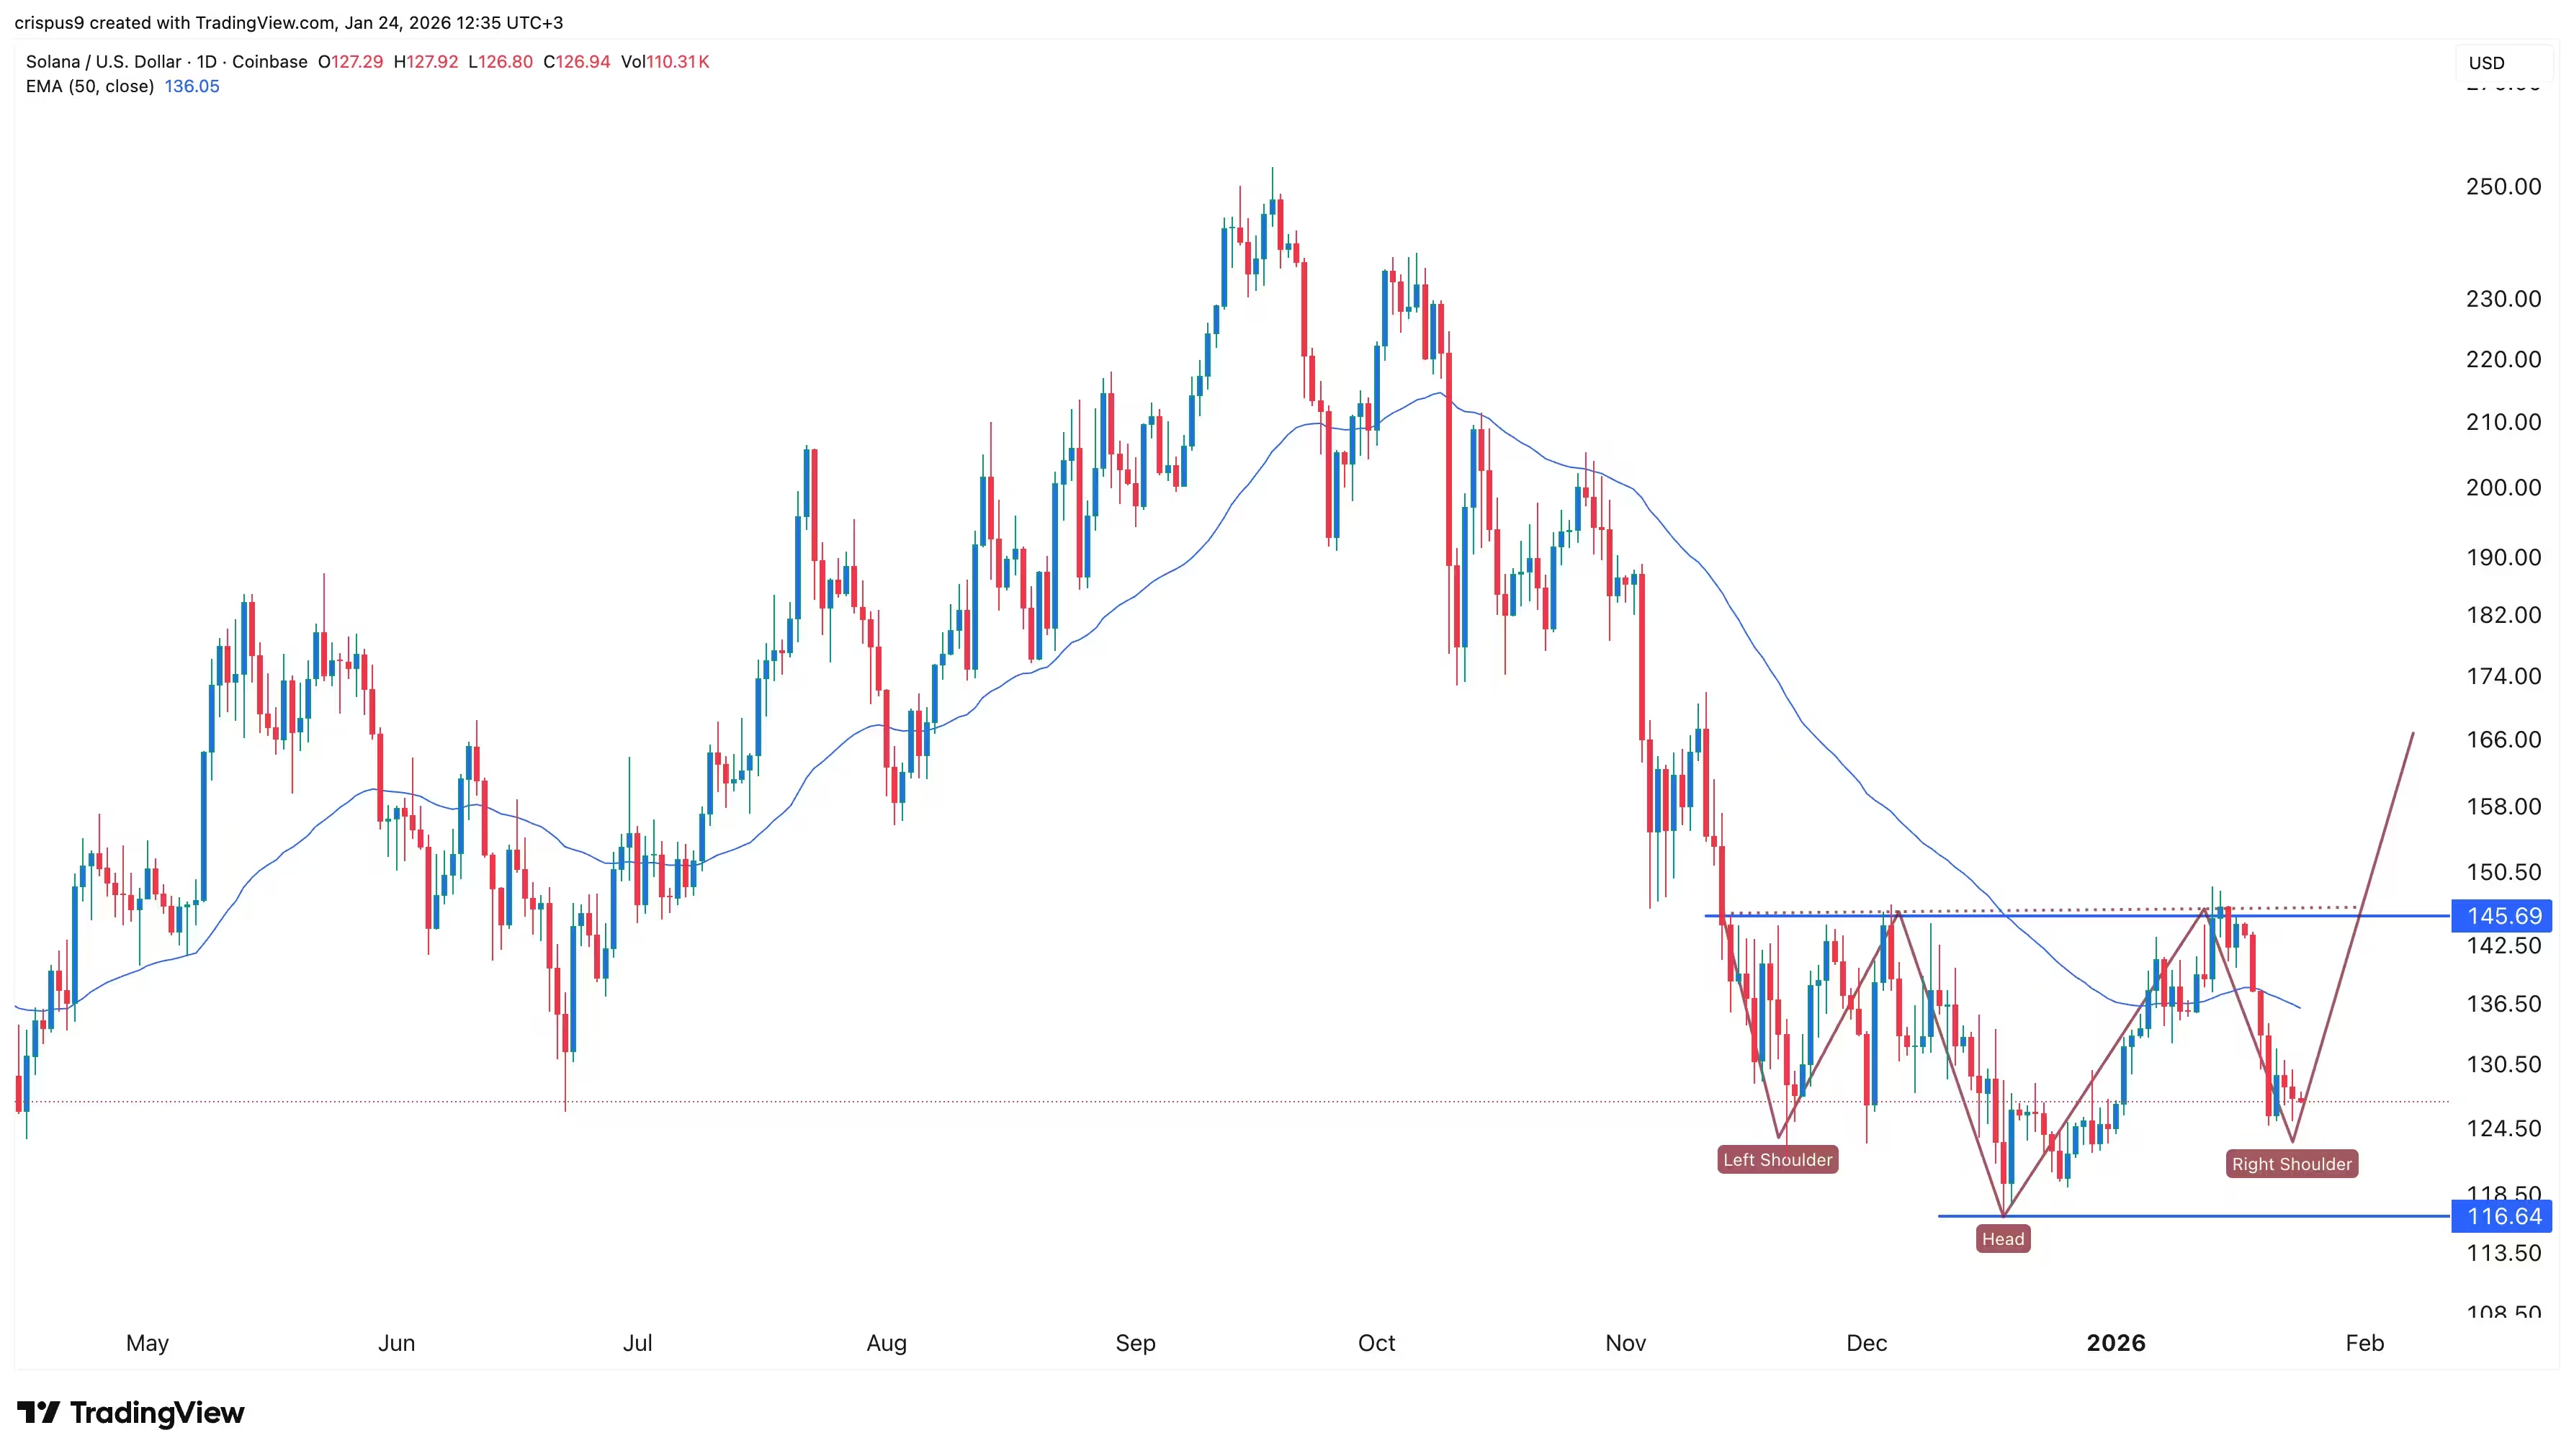
SOL price chart
If buyers reassert control, the immediate target is the YTD high at approximately $148. A decisive break above that level would open the door for additional upside toward the psychological $200 mark. Conversely, a clear break below the primary support near $118 would invalidate the bullish patterns and could trigger further downside pressure in the near term.
What to watch next
- Adoption signals: continued growth in transactions, active users and stablecoin flows will be positive for long-term SOL demand.
- Protocol upgrades: the upcoming Alpenglow upgrade is expected to improve performance and may enhance developer interest and throughput.
- Key price levels: resistance around $148 and $200; critical support at $118.
Overall, Solana’s on-chain metrics and ecosystem activity remain compelling. While the recent pullback weighed on SOL price, the combination of strong network usage, growing fees, and bullish chart setups suggests a high-probability scenario for a near-term rebound—provided support levels hold and upgrades like Alpenglow deliver as expected.
Source: crypto
Leave a Comment