
XRP near $1.51 as ETF demand stays elevated
XRP is trading around $1.51 as institutional interest from U.S. spot exchange-traded funds remains a central driver of demand. The market is watching a tight technical band: immediate resistance sits near $1.60–$1.62, while the Bollinger Band midpoint and the nearest chart support are close to $1.43. With roughly $1.79 billion in cumulative net inflows into U.S.-listed XRP ETFs since their launches, inflows are supplying verifiable, transparent demand — but they do not guarantee a move to a specific price target such as $1.80.
CoinGecko places XRP near $1.51 at the latest update, with a 24-hour trading range of about $1.47 to $1.54 and volume north of $4.2 billion. Market capitalization stands near $95 billion based on an approximate circulating supply of 62.9 billion XRP. These on-chain and market metrics provide context for both short-term technical setups and the broader narrative that has prompted advisors and institutions to take notice.
Technical picture: key levels, Bollinger Bands and momentum
Support and resistance to watch
The most immediate technical barrier is the $1.60–$1.62 zone. XRP has approached this area multiple times without building a sustained breakout, making it the first meaningful hurdle for continued upside. A daily close above $1.62 would push price outside the upper Bollinger Band and open the path back toward last week’s high near $1.65–1.66 and beyond.
On the downside, the 20-day Bollinger midpoint around $1.43 is the nearest technical support. Should XRP lose that level, the token would fall below its short-term center line and risk weakening the current mild bullish trend.
Momentum indicators
Momentum is constructive but cooling. The Relative Strength Index (RSI) sits near 57.50, a notch below its moving average of roughly 58.06 and clearly above the neutral 50 mark. This reading indicates bullish bias without pushing XRP into conventional overbought territory. Daily Bollinger bands frame the current volatility: the lower, middle, and upper bands create a contained trading range where price is holding above the center but below the upper band.
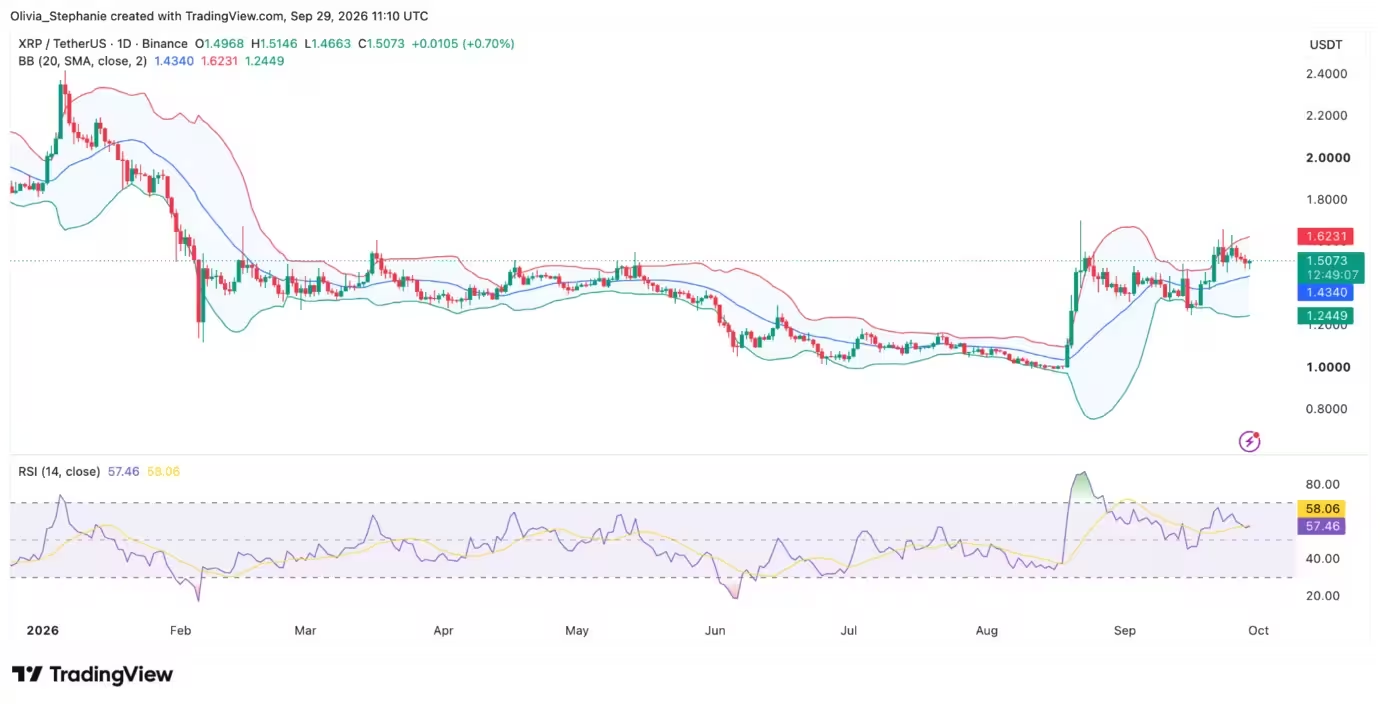
XRP price chart

As recent price history shows, the token briefly reached $1.6581 on Sept. 23 before sellers reasserted themselves. That puts the $1.65–1.66 area as the next test after clearing $1.62. Failure to move decisively higher would likely keep XRP consolidating between $1.43 and $1.62 for the near term.
ETF inflows: how much demand and why it matters
U.S.-listed spot XRP ETFs have recorded cumulative net inflows around $1.79 billion since launch, according to SoSoValue data cited in market reports. Net assets across the ETF group have tracked market price and stood near $1.68 billion after peaking around $1.77 billion on Sept. 25. The difference between net inflows and net assets is crucial: inflows measure fresh capital entering the vehicles, while net assets fluctuate as the ETF’s underlying holdings change value.
Bitwise, Canary Capital and Franklin Templeton have emerged among the largest products by flows. For example, Canary Capital’s XRPC picked up an additional $3.96 million on a Monday in late September, while aggregates show the ETF complex continued to attract fresh capital throughout Q3.
Product specifics: custody and fees
Bitwise’s XRP ETF has been one of the more notable vehicles. Trading on NYSE Arca under the ticker XRP, the fund charges a 0.34% annual sponsor fee and stores its holdings with Coinbase Custody Trust Company. SEC filings outline that Coinbase Custody maintains segregated accounts for the trust’s XRP, which is an important operational detail for advisors and institutions evaluating custody and counterparty risk.
It’s also worth noting that regulatory filings and routine amendments to registration do not necessarily indicate new approvals; they are often part of ongoing disclosure and registration maintenance for operating funds.
Institutional interest: why advisors are paying attention
Bitwise Chief Investment Officer Matt Hougan has described XRP as appealing to financial advisors for two primary reasons: persistence and real-world utility. First, XRP has a long operating history, having navigated multiple market cycles and lengthy regulatory scrutiny in the U.S. That longevity can reduce concerns among advisors about asset permanence.
Second, advisors can connect XRP to payment and liquidity use cases they already understand. XRP is the native token of the XRP Ledger (XRPL), and Ripple develops payment rails, stablecoins and institutional products that leverage XRPL infrastructure. That practical narrative helps bridge the knowledge gap for wealth managers and advisors who may be more comfortable allocating to assets with clearer real-world applications.
Interest among wealth managers was visible during a Bitwise presentation attended by roughly 400 wealth managers, where XRP reportedly generated more questions than any other crypto asset. That anecdotal demand aligns with the fund flow data showing steady inflows into XRP ETFs in Q3.
Scenario analysis: can ETF flows boost XRP to $1.80?
ETF inflows are real, trackable demand that can support price, but they are not a guarantee of a move to a precise level like $1.80. A clear pathway to $1.80 typically requires the following sequence:
- A daily close above $1.62 that confirms a break of the current upper Bollinger Band.
- Follow-through buying that reclaims the recent $1.65–1.66 highs and attracts fresh momentum-led traders.
- Continued or accelerating ETF inflows that keep upward pressure on the underlying supply/demand balance.
If those elements align, $1.80 becomes a reasonable intermediate target on the next leg higher. Conversely, if price stalls below $1.62, or if flows slow and liquidity dries up, XRP is likely to remain range-bound between $1.43 and $1.62.
Bull case
- Sustained ETF inflows drive consistent buying pressure.
- Price breaks above $1.62 with strong daily closes and volume expansion.
- Positive macro or crypto-specific catalysts lift risk appetite, allowing XRP to retest and exceed $1.66 on the way to $1.80.
Bear case
- ETF inflows slow or reverse, removing a key source of demand.
- XRP fails to breach $1.62 and loses the Bollinger midpoint around $1.43, signaling a breakdown of the short-term bullish structure.
- Broader market sell-offs push the token lower despite ETF activity.
Risk considerations and final takeaways
Investors should view ETF inflows as a supportive element rather than a deterministic force. While spot XRP ETFs provide transparent, institutional-grade demand, price moves still depend on market structure, liquidity, buyer conviction and broader crypto market dynamics.
Key metrics to monitor in the near term:
- ETF net inflows and net asset trends across U.S. products.
- Daily closes relative to $1.62 and the upper Bollinger Band.
- Volume expansion on breakouts and RSI behavior for signs of overbought conditions.
- Macro risk sentiment and newsflow related to Ripple, XRPL, and regulatory developments.
In summary, ETF demand strengthens the case for higher prices by bringing persistent, observable capital into XRP exposure. A sustained breakout above $1.62 would increase the likelihood of a move toward $1.80, but until buyers can close decisively beyond the current resistance, XRP is likely to trade within the defined consolidation range between roughly $1.43 and $1.62.

Investors and traders should combine on-chain data, ETF flow reports and technical confirmation before assuming a clear path to $1.80.

Leave a Comment
Comments (1)
Can ETF inflows really push XRP to $1.80? Seems premature 1.62 is the real hurdle. Volume needs to show up, else rangebound again.