

Market snapshot: Bitcoin dips as Treasury yields surge
Bitcoin traded near $83,100 after a pullback from last week s highs, with rising US Treasury yields weighing on risk assets and pushing BTC back toward the lower boundary of its recent range. The 10-year Treasury yield climbed to roughly 5.27%, its highest level since 2007, as investors reassessed interest-rate expectations amid inflation concerns and stronger commodity prices. That macro backdrop pressured not only bitcoin but also a broad swath of cryptocurrencies, with Solana, Hyperliquid and Zcash among notable decliners.
Summary of key developments
- Bitcoin near $83,100 as bond yields reassert pressure on risk appetite. - Ten-year yields rose to about 5.27%, the highest in nearly two decades. - Binance exchange reserves fell by roughly 23,000 BTC between Sept 21 and Sept 28, according to CryptoQuant. - Analysts identify $83,000 as immediate support; liquidation clusters sit around $85,300 above spot. - Futures open interest has declined for over a week as leveraged longs and shorts shrink. - Traders are focusing on the August personal consumption expenditures report and other US data for directional cues.
Macro forces: Why higher yields hurt BTC
Higher Treasury yields have reemerged as a primary macro headwind for bitcoin. When government bond yields rise, the relative attractiveness of risk assets can diminish as the opportunity cost of holding speculative positions increases. The recent climb in both 10- and 30-year yields reflects a market pricing in more persistent inflation and a higher terminal fed funds rate, tightening financial conditions globally.
The Federal Reserve lifted its target range by 25 basis points on Sept 16 to 3.75%–4.00%, citing resilient economic activity and elevated inflation. Markets are now bracing for the August PCE inflation release, scheduled on Sept 30, a key report used by the Fed to gauge inflation trends. July s headline PCE was 3.7% year over year, with core PCE at 3.3% — numbers that could keep rate expectations elevated and markets cautious.
Technical picture: Support, momentum and liquidation zones
BTC s recent rejection near $86,000–$87,000 has pulled price back into a consolidation phase, testing the $83,000 support zone that traders are watching closely. On a daily scale, bitcoin has maintained higher highs and higher lows relative to mid-August levels around $63,000–$65,000, but short-term momentum indicators are showing signs of cooling.

The 14-period RSI sits above the neutral 50 level but below the overbought threshold, signaling that momentum is reduced from the recent advance. Similarly, the MACD line has made a small bearish crossover with the signal line, and the histogram has turned slightly negative — a technical hint that the short-term bullish impulse has weakened even though both MACD lines remain above zero.
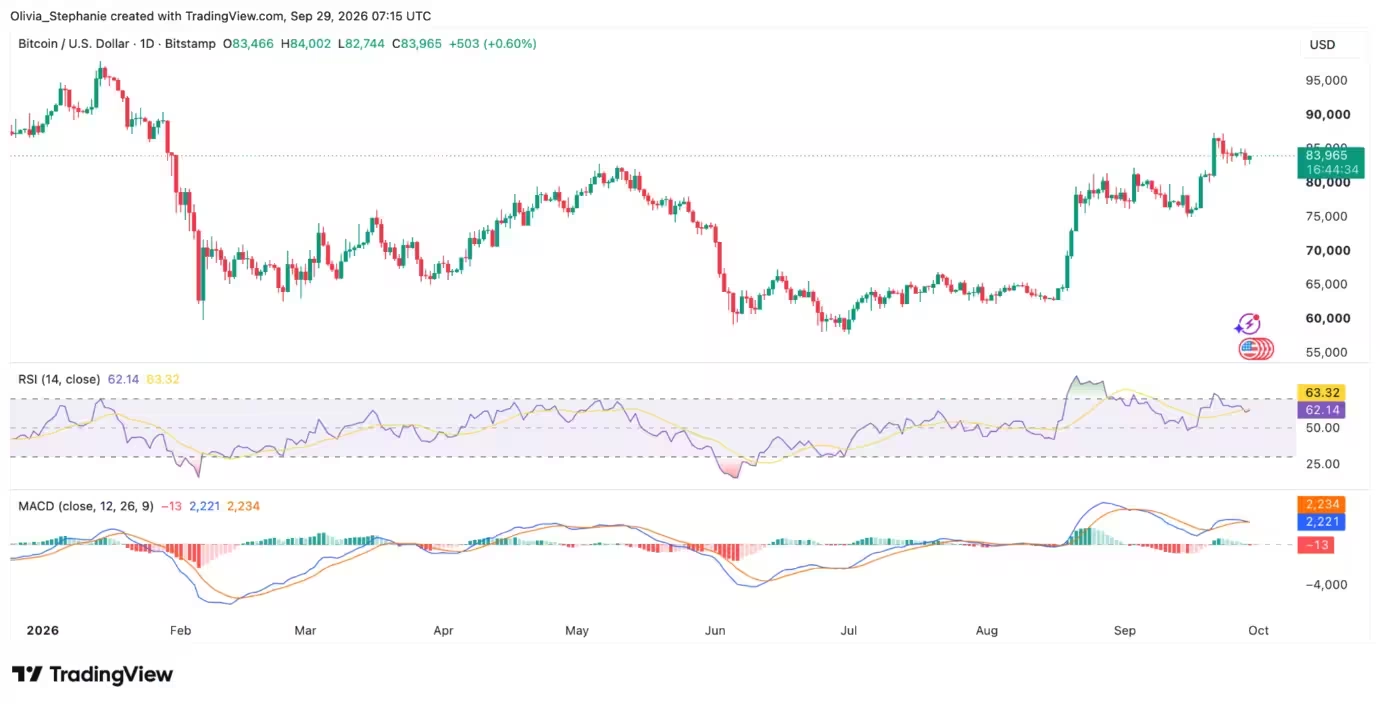
Bitcoin (BTC) price chart
Previous technical analysis flagged the $83,600 area as a critical support following the $87,000 rejection. Market commentators such as Rekt Capital view a successful retest of the breakout boundary as trend-defining — preserving the higher-range structure if BTC holds, or returning price to the earlier consolidation zone if it breaks down.
Where liquidation liquidity sits
Derivatives data show a notable concentration of stop-loss and liquidation orders around $85,300. That band overlaps with recent sell-side liquidity identified between $85,000 and $85,800. If BTC can reclaim the mid-$85,000s, it would reopen the path toward the prior $87,000 high. Failure to do so leaves the $82,000–$83,000 range as the nearest visible support.
Derivatives and open interest: Leverage outflows
Futures market positioning reveals leverage is leaving the market, with open interest contracting for more than a week. This decline reflects liquidations of highly leveraged long positions as well as a reduction in short exposure. Lower open interest can reduce volatility in the near term, though it also means fewer liquidity-driven squeezes that historically catalyze rapid rallies.
Analysts note that shrinking short exposure removes one persistent source of selling pressure, but it does not guarantee an imminent recovery. With both long and short positions compressed, the market may trade in a range until a clear macro catalyst emerges, such as the upcoming PCE print or shifts in Treasury yields.

Exchange reserves: Binance outflows and stablecoin balances
On-chain exchange reserve metrics add nuance to the current setup. CryptoQuant analyst Amr Taha reported Binance s Bitcoin reserves declined from about 701,000 BTC on Sept 21 to around 678,000 BTC on Sept 28, a fall of roughly 23,000 BTC or about 3.3% in one week. Ethereum reserves moved lower too, decreasing from near 3.65 million ETH to roughly 3.54 million ETH over a similar span.
However, Binance s USDT balances stayed relatively high, hovering near $38.1 billion. That stablecoin pool is important because it represents available buying power. If those USDT balances begin flowing into spot markets, they could support a renewed bid for BTC and ETH. By contrast, falling exchange balances on their own do not unambiguously signal selling; assets can be transferred to cold storage or between platforms, so context matters.
Historical intramonth behavior also varied: in August, Binance users increased their BTC holdings by over 16,000 BTC even as ETH and USDT balances declined, underscoring that exchange-level flows can shift quickly and are not a singular predictive signal.
What traders should watch next
Key items to monitor in the short term: - US economic calendar: the Aug PCE inflation report on Sept 30 is the priority macro release that could move yields and risk appetite. - Treasury yields: sustained moves above recent multi-decade highs would likely keep pressure on BTC and crypto risk assets. - Open interest and funding rates: further contraction would suggest lower leverage and potentially muted volatility, while a pickup could foreshadow directional moves. - Exchange reserves and USDT flows: a drawdown in stablecoin balances into spot order books could provide buying support for a recovery. - Technical reclaim levels: a breakthrough above $85,300–$85,800 would point back to the $87,000 zone, while a failure increases the probability of a deeper retest of the $82,000–$83,000 zone.
Outlook: Consolidation until a macro catalyst arrives
Bitcoin remains materially above mid-August lows and retains a broader bullish structural picture, but elevated Treasury yields and cooling momentum have placed BTC in a consolidation phase. Traders should expect range-bound action unless a clear catalyst — either hawkish inflation prints or a shift lower in yields accompanied by on-chain stablecoin flows — triggers a decisive breakout.
Risk management remains essential: liquidation clusters and concentrated sell orders in the mid-$85,000s underline the asymmetric risk around current levels, while the $83,000 area stands as the immediate technical line in the sand. For now, macro conditions and derivatives positioning will dictate whether BTC can resume its upward trend or continue to consolidate below recent highs.


Leave a Comment
Comments (1)
Binance outflows + huge USDT piles... is this even bullish? Yields look like the real driver, feels like a fake breakout imo, watch PCE