

TD Sequential flags for SUI, AAVE and LINK
Three well-known altcoins — Sui (SUI), Aave (AAVE) and Chainlink (LINK) — registered technical buy signals as the market attempts to recover from October’s broad selloff. Crypto analyst Ali Martinez highlighted three-day TD Sequential setups on November 4, suggesting these tokens could see short-term rebounds if buyers sustain momentum. While the setups point to potential upside, each project still faces key resistance levels that must be cleared to confirm meaningful trend reversals.
How the TD Sequential matters in the current market
The TD Sequential indicator is a momentum-based tool used by traders to identify potential trend exhaustion and early reversal points. On multi-day charts, a buy signal can imply a pause in selling pressure and the possibility of a counter-trend bounce. In thin or choppy crypto markets, however, these signals often require follow-through volume and confirmation from other indicators — such as moving averages, RSI or MACD — before traders treat them as reliable entries.
SUI: Buy signal, but resistance near $0.95–$1.04
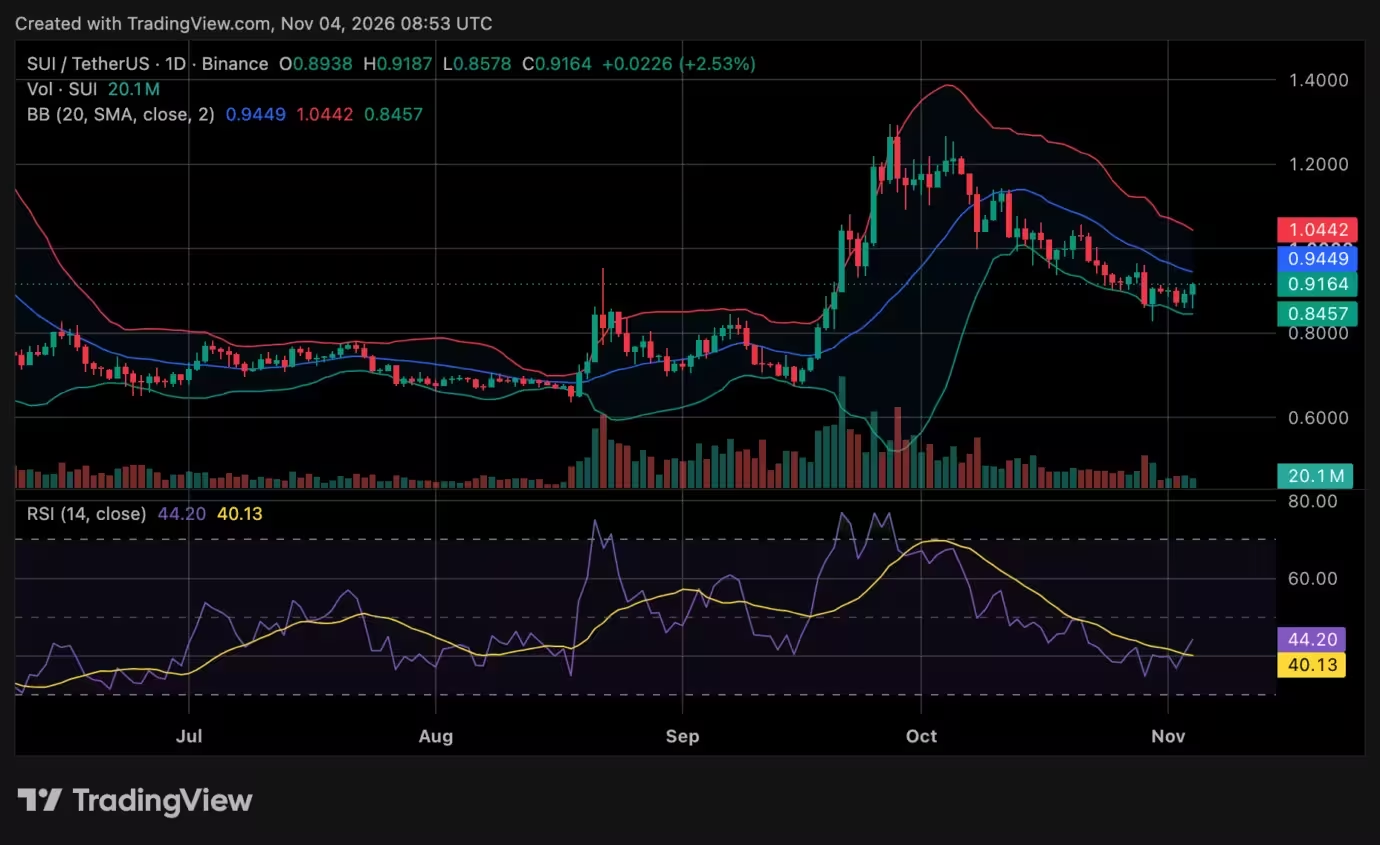
Sui (SUI) emerged as one of the coins showing a three-day TD Sequential buy signal. At the time of Martinez’s analysis, SUI traded near $0.92 after recovering from a low around $0.86. The token remains under its 20-day Bollinger Bands middle band (~$0.95), with the upper band close to $1.04 — levels that will act as near-term technical hurdles should buyers push higher.
Martinez flagged $0.90 as an immediate pivot and set initial upside targets at $1.11 and $1.20 if the rebound gains traction. A sustained break above the $0.95 area would expose $1.00 and then the upper Bollinger line near $1.04, making $1.11 the logical subsequent resistance zone.
Additional metrics offer a mixed view: the Relative Strength Index (RSI) was around 44.20, above its moving average of 40.13 but still below the neutral 50 level — indicating improving buying interest but no firm bullish conviction yet. Other analysts pointed to $0.85–$0.90 as important support; failure to defend those levels could invalidate the TD Sequential bounce and leave SUI vulnerable to further downside.
SUI price chart
AAVE: Rebound flagged but moving averages cap gains
Short-term targets and key averages
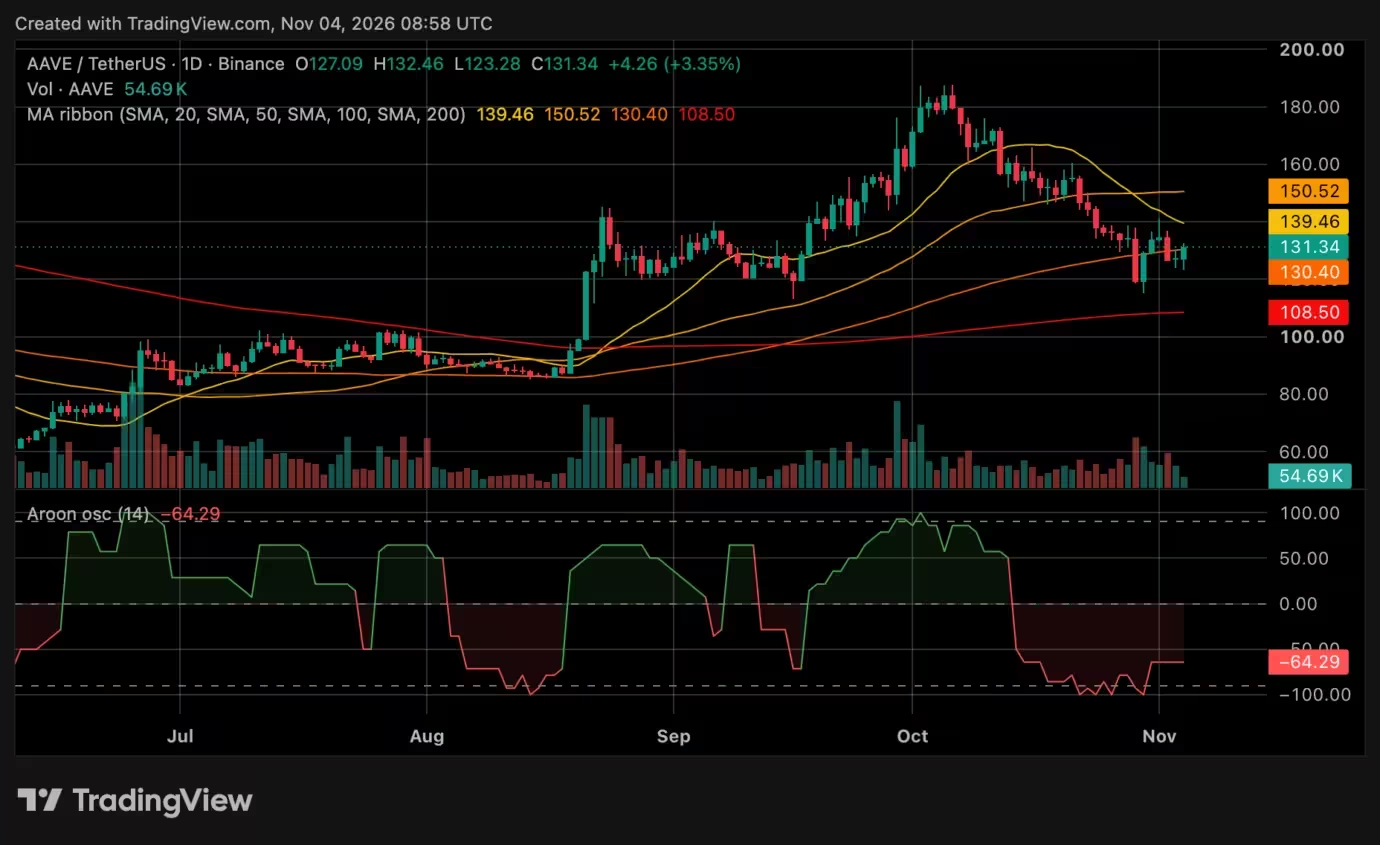
Aave recovered to roughly $131 after dipping to about $123, and Martinez noted a three-day TD Sequential buy signal for AAVE as well. He identified $146 as the first meaningful upside objective, with $176 cited as a more extended target tied to the setup’s trendline.
Despite the bullish signal on the three-day chart, AAVE’s daily picture remains cautious. The token was trading below its 20-day moving average (~$139) and the 50-day (~$150), while the 100-day average near $130 provided immediate support. The Aroon Oscillator reading around -64.29 suggested bearish momentum still has influence on the daily timeframe.
Martinez suggested that AAVE needs to reclaim $139 to put the $146 target within play; conversely, losing the $130 support could expose $120. Earlier in the week the analyst cited a rebound of about 16% from an October 30 reading, demonstrating how volatile short-term moves can be for mid-cap DeFi tokens.

AAVE price chart
LINK: Breaking $11.30 key to a move toward $12.71
On-chain adoption and technical outlook
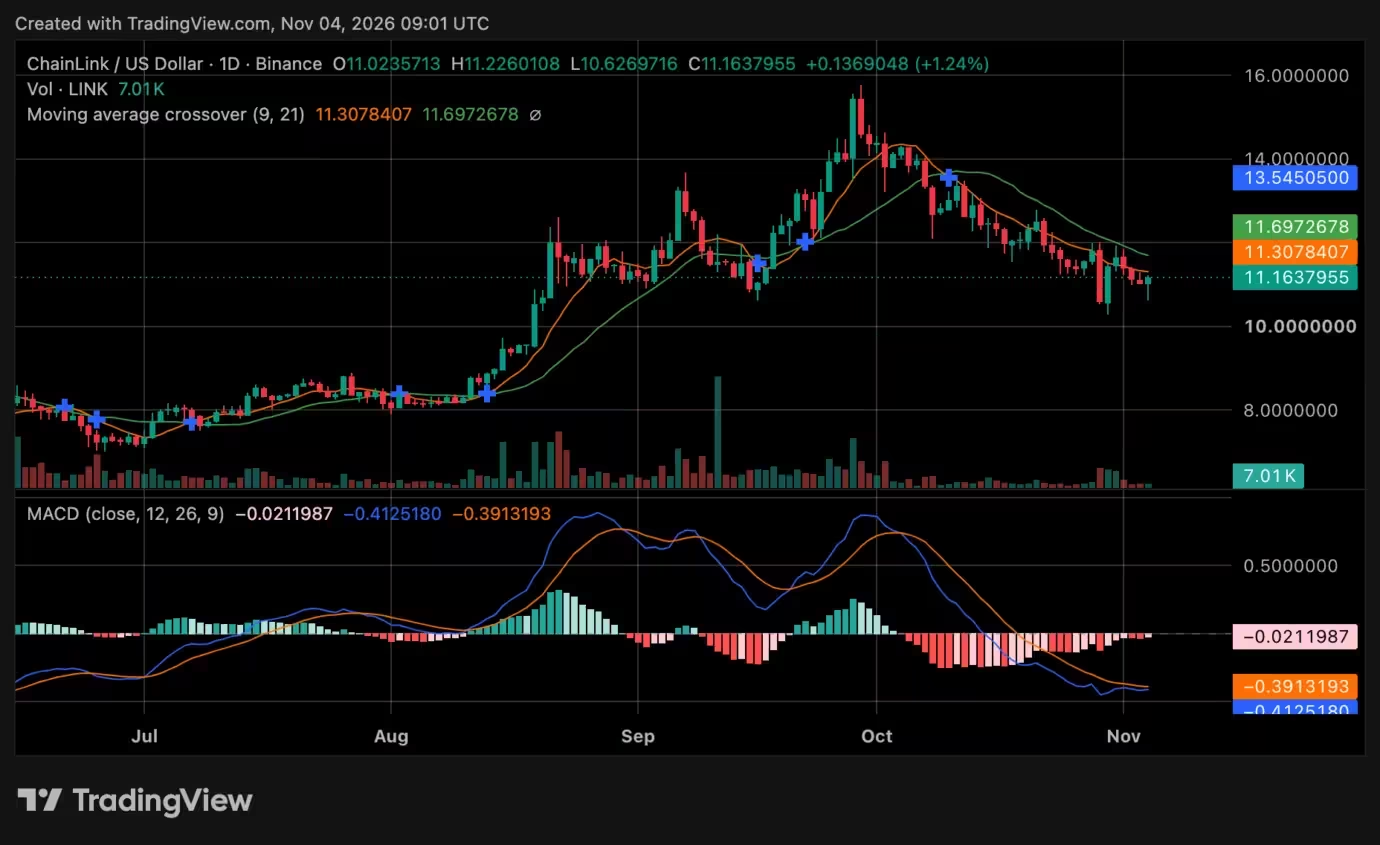
Chainlink was trading near $11 after recovering from intraday lows around $10.60, and it also produced a three-day TD Sequential buy signal. Martinez singled out $11.30 as the near-term resistance to watch — a break above that area could clear the path to a $12.71 objective, with the trendline resistance from the TD Sequential near $14 acting as a further upside barrier.
On the daily chart, LINK was below shorter-term moving averages: the nine-day near $11.31 and the 21-day near $11.70. The MACD reading was slightly negative (-0.4125 against a signal line of -0.3913) with a small negative histogram (-0.0212), though the shrinking negative bars suggested selling pressure was easing.
Beyond the charts, Chainlink has strengthened its narrative with product adoption: the firm rolled out 24/7 pricing feeds for tokenized real-world assets, and Aave has adopted Chainlink’s pricing service for tokenized stock collateral — a move that supports valuation windows during weekends and market holidays. These real-world integrations can underpin medium-term fundamentals even if short-term price action remains choppy.
Chainlink (LINK) price chart
What traders should watch next
All three altcoins show early signs of bullish setup on the three-day TD Sequential, but the follow-through will depend on several confirmation points: higher trading volume, clear breaks above near-term moving averages and closing prices beyond the resistance levels cited by analysts. Key technical thresholds to monitor are:
- SUI: reclaiming $0.95 and then testing $1.00–$1.11
- AAVE: retaking the $139 level to unlock $146 and potentially $176
- LINK: breaking $11.30 and moving past the 21-day average toward $12.71
Stop-loss planning and position sizing remain essential. The TD Sequential can offer early entry clues for tactical traders, but without validation from volume and complementary indicators like RSI, moving averages, or MACD, these setups can become false signals in volatile crypto markets.
Conclusion: Signals are interesting but not yet decisive
Ali Martinez’s three-day TD Sequential readings on SUI, AAVE and LINK point to the possibility of short-term rebounds following October’s selloff. However, each altcoin faces meaningful resistance that must be overcome for a sustained recovery. Traders and investors should balance technical signals with on-chain adoption narratives — such as Chainlink’s 24/7 pricing and Aave’s integration — while managing risk through clear entry, target and stop-loss levels.

In fast-moving markets, patience and confirmation are often the difference between catching a genuine trend and getting caught in a short-lived bounce. Watch the moving averages, volume and RSI/MACD confirmations to gauge whether these TD Sequential buy signals evolve into a broader reversal.

Leave a Comment
Comments (1)
Hmm TD Sequential showing buys on 3-day, but where's the volume? Could be fake breakout... SUI/AAVE need real follow thru, not just setups.