

Market snapshot: Bitcoin slides below $77K
Bitcoin (BTC) slipped below the $77,000 mark on November 3, pressured by a fresh wave of institutional outflows, forced liquidations of leveraged positions and a broader pullback in global technology stocks. According to crypto.news market data, BTC was trading around $76,460 — down roughly 2.19% over 24 hours — with a 24-hour trading volume near $26.62 billion and a market capitalization close to $1.54 trillion.
The single-day drop extended Bitcoin’s weekly decline to about 3.6% and erased a short-lived recovery that had pushed prices near $78,000 at the start of the week. Risk-off sentiment ahead of the U.S. midterm elections and persistent concerns around institutional demand for Bitcoin ETFs have kept buyers on the defensive.
Why ETF flows matter right now
Institutional activity in spot Bitcoin exchange-traded funds remains a crucial driver of price dynamics. Data from SoSoValue showed substantial net outflows from U.S. spot BTC ETFs on November 2, with funds recording approximately $398.6 million in redemptions. BlackRock’s IBIT was the largest contributor to the drain, accounting for about $405.3 million of withdrawals, while other products managed marginal inflows — for example, Fidelity’s FBTC attracted roughly $6.68 million during the session.
These ETF outflows followed an even larger wave of redemptions on October 30, when spot Bitcoin ETFs lost $643.3 million in a single day — the biggest one-day withdrawal since June. The slide in institutional flows has coincided with fallout from a major Binance security breach that exposed roughly $6.3 billion in crypto assets and triggered additional selling and caution among institutional allocators.
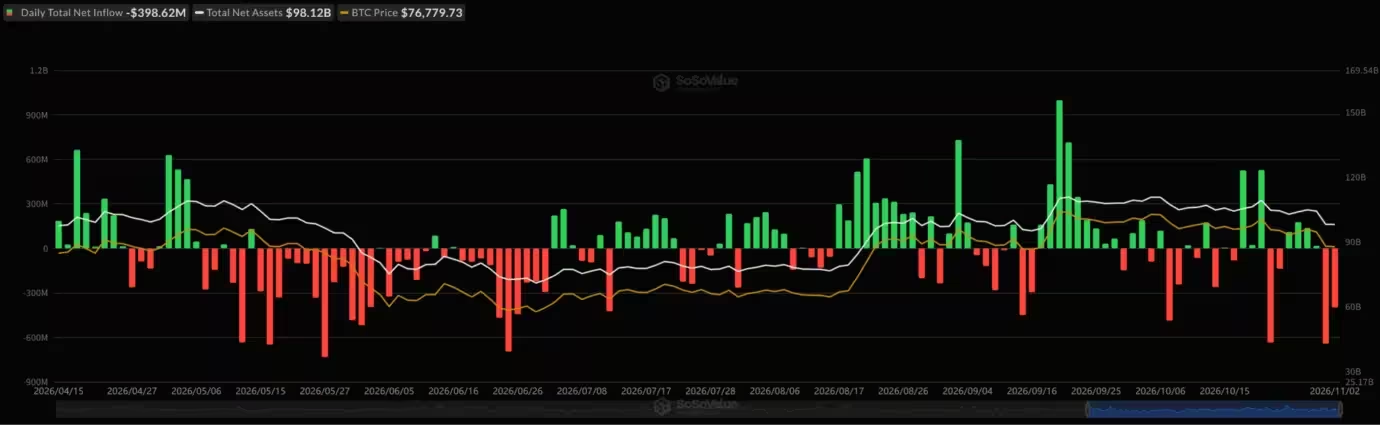
Bitcoin ETFs flows
Ethereum-focused ETFs also showed weakness. On November 2, Ethereum ETFs posted about $140 million in net outflows, signaling that institutional selling pressure is broad-based across leading crypto products, not limited to Bitcoin alone.
Tech stocks, midterms and macro risk
Market weakness in global technology equities added pressure to cryptocurrencies. Stocks tied to artificial intelligence and semiconductor manufacturing lost ground on Tuesday, and Asian equity indices followed suit after heavy selling in major U.S. tech names.
Investors were also cautious ahead of U.S. midterm elections, which can increase uncertainty in risk assets. That macro risk often translates into lower demand for speculative assets like Bitcoin, amplifying volatility during periods of geopolitical or political uncertainty.
Derivatives, leverage and forced liquidations

Derivatives activity exacerbated the decline as leveraged traders were hit with forced exits. CoinGlass and other liquidation monitors recorded nearly $88.83 million in Bitcoin liquidations over the prior 24 hours, with the bulk coming from long positions that no longer met margin requirements.
When exchanges automatically close highly leveraged trades, that selling can cascade into additional downward pressure on spot prices. Given Bitcoin’s recent volatility, leveraged bulls are particularly vulnerable to margin calls, which can accelerate price moves to the downside.
Technical outlook and key levels to watch
Technical indicators point to persistent weakness on Bitcoin’s daily chart. Since early October, BTC has been forming lower highs and lower lows — a classical sign of a downtrend. The Relative Strength Index (RSI) sits near 34.26, under its moving average of 41.67, indicating subdued buying momentum without yet reaching the conventional oversold threshold of 30.
MACD readings remain negative as well: the MACD line was approximately -1,363.94 versus a signal line near -885.06, leaving a negative histogram near -478.88. Those momentum readings suggest downward pressure remains intact until a decisive technical reversal emerges.
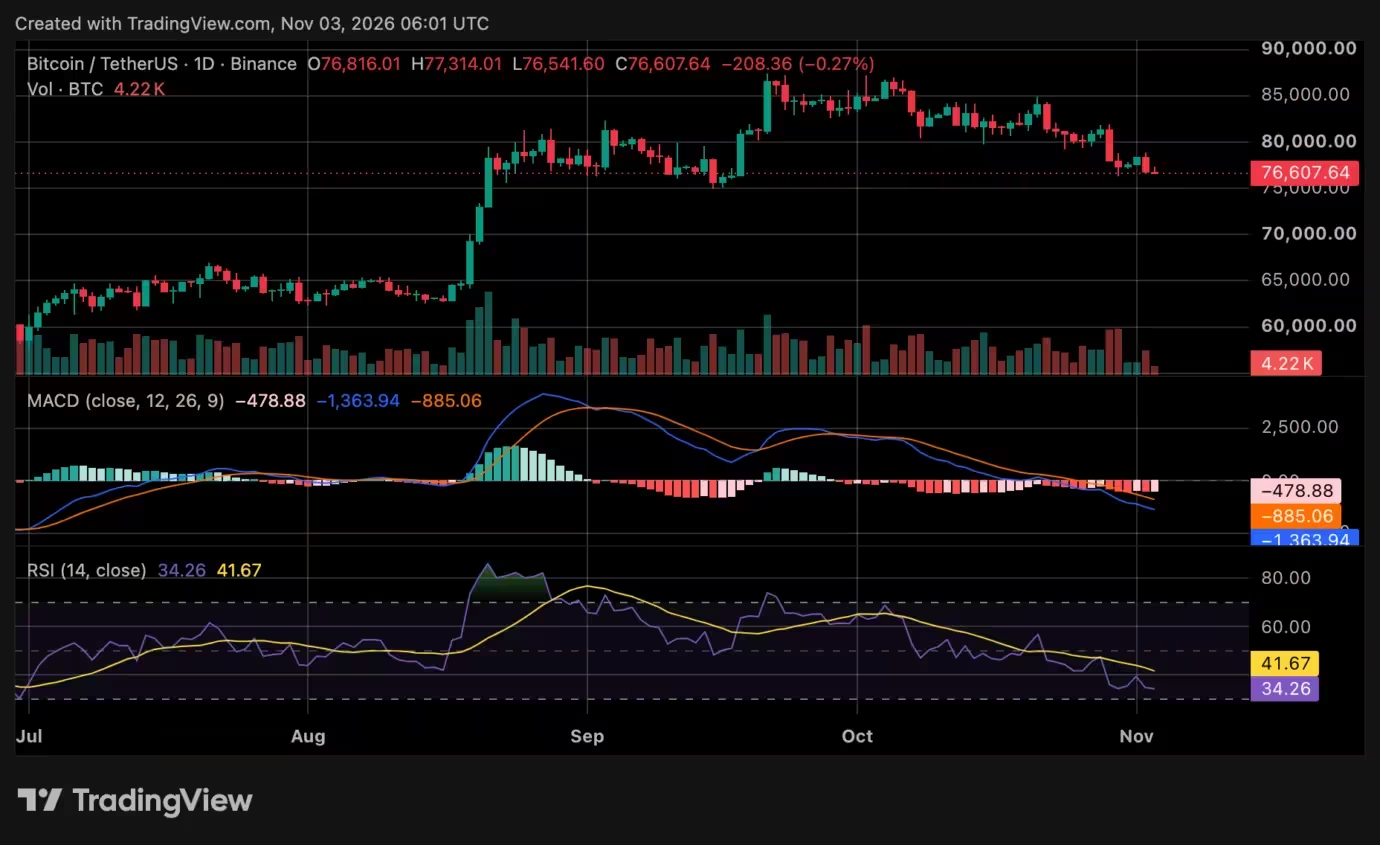
Bitcoin price chart
Immediate support
- Near-term support appears around $76,400–$76,500. Analysts highlight the $76,400 area as a critical short-term level; a convincing close below that zone on a four-hour or daily timeframe could open the door to deeper losses.
- Additional floors include $75,602 (near the 50-week moving average) and roughly $75,000. A sustained breach of these levels could push BTC toward $74,800 or lower.
Key resistance
- On the upside, Bitcoin faces resistance near $78,000, followed by $79,500 and the psychologically important $80,000 level.
- Reclaiming $79,500–$80,000 would be an early sign that bullish momentum is returning and could attract renewed institutional and retail interest.
Market commentary and strategic implications
Crypto analysts have flagged the $76,400 pivot as one to watch. One popular trader noted that losing that support convincingly could trigger another leg down, while a recovery above $79,500 would shift the technical outlook more favorably.
Another trader pointed to Bitcoin’s yearly performance context: BTC has historically not closed two consecutive yearly candles negative, and the 2026 yearly open sits around $87,500 — well above the current market price. That observation frames the current pullback as part of the longer-term performance debate, but it offers limited near-term protection against further downside.
For traders and investors, the combination of ETF flows, broader equity weakness, and derivatives liquidations means risk management is essential. Position sizing, stop-loss discipline and an awareness of macro catalysts remain critical when navigating volatile crypto markets.
What to watch next
- ETF flow updates: Continued daily inflows or outflows from major spot Bitcoin ETFs will likely remain a primary price driver.
- Leverage and liquidation metrics: A fresh round of forced liquidations could intensify volatility; monitoring open interest and funding rates can provide early warning signals.
- Macro calendar: The next notable U.S. data arrives on November 6, when the October employment report is due. Economic surprises can shift risk sentiment and impact crypto prices.
Conclusion

Bitcoin’s move below $77,000 on November 3 reflects a confluence of factors: renewed institutional redemptions from spot Bitcoin ETFs, forced liquidations among leveraged traders, and a broader sell-off in technology stocks amid election-related caution. Traders should track ETF flows, derivatives metrics and upcoming macro releases to assess whether this pullback stabilizes or extends into lower support zones.

Leave a Comment
Comments
No comments yet. Be the first.