

Ethereum tumbles as markets sell off
Ethereum has plunged more than 8% in the past 24 hours, trading near $2,200 on November 6 as weakness in U.S. technology stocks, substantial crypto liquidations and renewed outflows from spot ETH exchange-traded funds pressured the market. According to crypto.news market data, ETH changed hands around $2,220 on November 6, down roughly 8.3% over a single day. Bitcoin also fell, sliding about 6.1% to near $75,500, while the total crypto market capitalization declined as investors cut exposure to higher-risk assets.
Key highlights
- Ethereum dropped over 8% as losses in tech shares rippled through crypto markets.
- CoinGlass reported roughly $210 million in ETH liquidations in 24 hours, with $179 million from leveraged long positions.
- U.S. spot Ethereum ETFs recorded nearly $100 million in net withdrawals on November 5.
- Exchange reserves for ETH have fallen toward 14.6 million, while derivatives open interest continued to decline.
- Technical indicators show immediate support near $2,200 and the RSI below 40, indicating limited buying momentum.
Macro and tech equity spillover
The latest leg down for Ethereum coincided with a broad sell-off in U.S. technology stocks. Concerns about rising borrowing costs and the return on investment for AI infrastructure weighed on the Nasdaq, prompting many investors to reduce exposures to growth-oriented and crypto-linked equities. That rotating out of risk assets spilled into digital assets, with major cryptocurrencies, including ETH and BTC, falling as part of the same move.
The decline followed a brief recovery after the November 3 midterm elections, when Democratic control of both chambers initially supported a short-lived rally. However, that bounce gave way to renewed risk-off sentiment, hitting several large-cap tokens. XRP and Solana were among the notable decliners on the day.
Market psychology shifted quickly: the Crypto Fear & Greed Index dropped to 28 on November 6 from 50 the previous day, signaling a move into the fear category after a neutral reading. A month earlier, the index had been at 71, underscoring how rapidly sentiment can reverse in volatile markets.
Derivatives and liquidation impact
Derivatives activity intensified selling pressure on Ethereum as leveraged positions were forced to close. CoinGlass data showed ETH liquidations of about $210 million in a 24-hour span, with long positions representing $179 million of that total. This suggests traders who were betting on higher prices bore the brunt of forced exits.
Across the crypto market, liquidations exceeded $1 billion as Bitcoin and several altcoins declined. Forced liquidations occur when margin or collateral falls below maintenance requirements and exchanges automatically close positions to manage risk.
Open interest trends
Ethereum’s derivatives market had been weakening even before this latest move. CryptoQuant data reported tracked open interest falling to near $11.4 billion by November 6, down from almost $16 billion in late September. Lower open interest indicates fewer outstanding futures and perpetual contracts, which can reflect position closures and reduced leverage usage among traders.
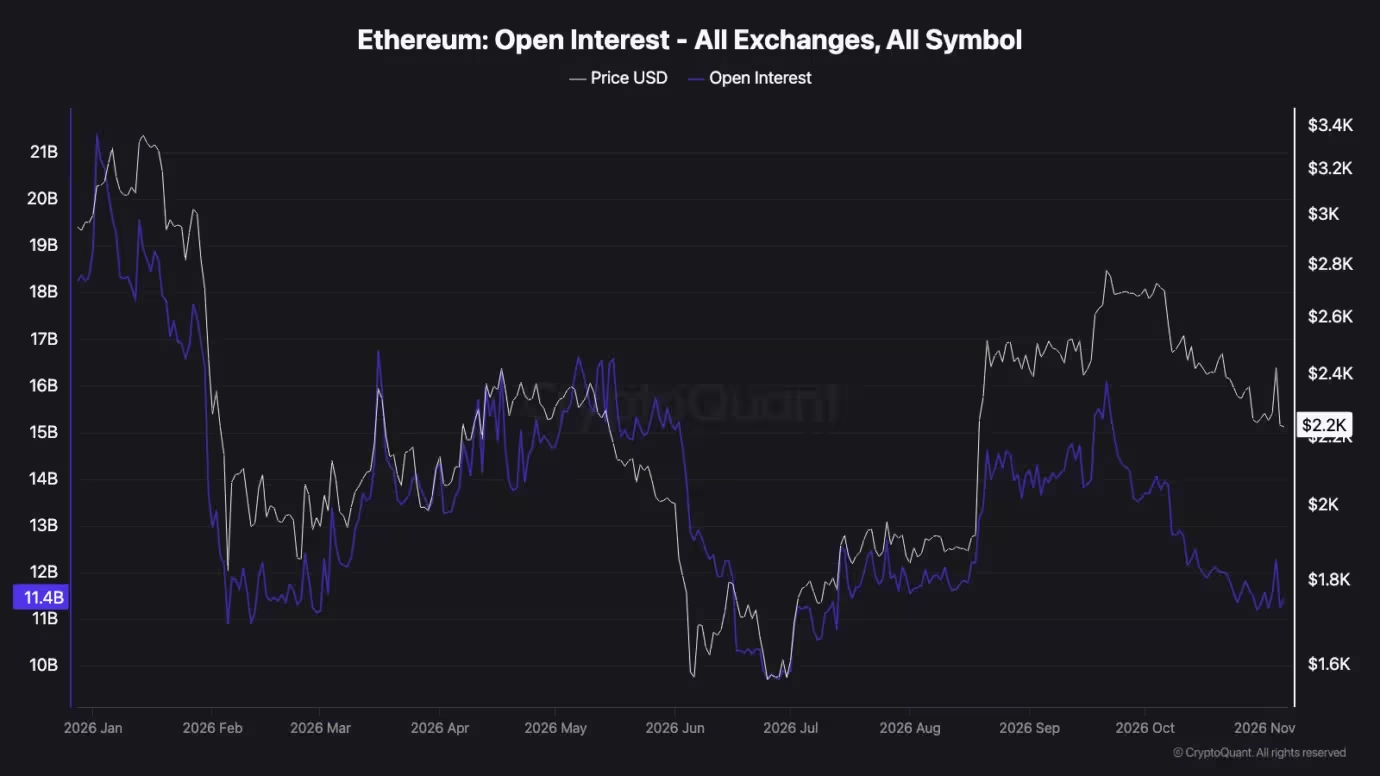
Ethereum open interest
Earlier reporting also highlighted episodes of concentrated liquidations. In October, crypto.news covered an event where Binance saw over $106 million in Ethereum liquidations inside a single hour during a market drop tied to inflation data.
Spot ETH ETF outflows add selling pressure
Institutional flows into or out of spot Ethereum ETFs have become an important driver of short-term price action. On November 5, U.S. spot ETH ETFs returned to net withdrawals, with SoSoValue reporting nearly $100 million in net outflows for the day. That reversed a $53 million inflow recorded the day prior.
BlackRock’s ETHA led outflows with $75.2 million withdrawn, while its ETHB fund saw roughly $22 million in redemptions. Fidelity’s FETH experienced $2.2 million in outflows and Grayscale’s ETHE reported about $500,000 in redemptions. These withdrawals followed earlier activity with net outflows of $139.7 million on November 2 and $85.3 million on November 3, indicating sustained distribution pressure over several sessions.
Exchange reserves continue to shrink
In parallel, Ethereum held on exchanges has continued to decline. CryptoQuant data shows centralized exchange balances falling from more than 21 million ETH in early 2025 to roughly 14.6 million ETH as of November 6. Lower exchange reserves can suggest reduced selling supply on platforms, but withdrawals may reflect staking, transfers to private custody or inter-exchange movements, and do not automatically translate into stronger buying demand.
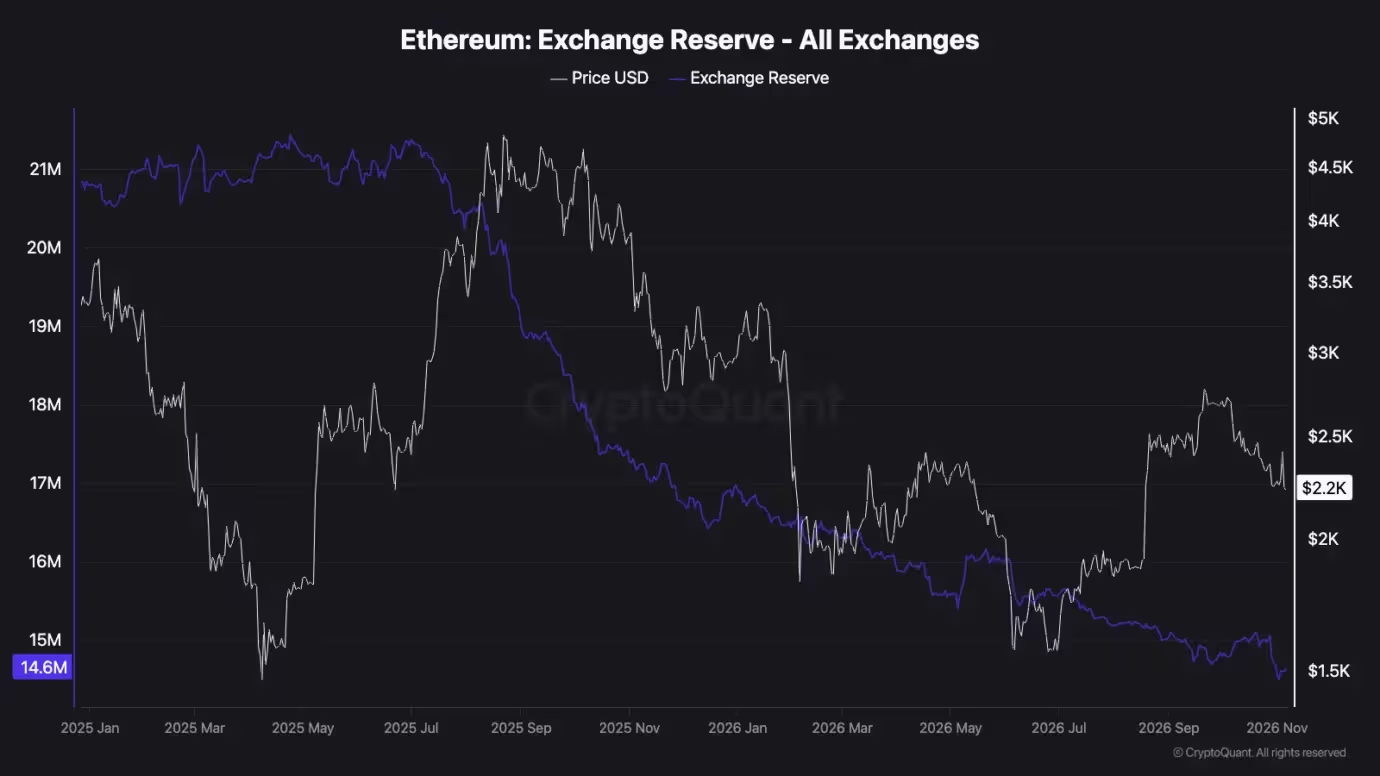
Ethereum exchange reserve
Technical outlook: support and resistance to watch
From a technical perspective, Ethereum failed to sustain a recovery toward the $2,440–$2,450 zone and lost the gains it posted after the midterms. Momentum indicators point to weak buying pressure. The Relative Strength Index was about 38.65, below the neutral 50 line but not yet in deep oversold territory below 30. That level implies sellers still have the upper hand while buyers remain muted.
The MACD line stood around -59.79, slightly above its signal line at -60.77, producing a modest positive histogram reading of 0.98. While that suggests a small improvement in momentum, both MACD lines remain below zero, consistent with a prevailing bearish tone.
Immediate technical support is located near $2,200, followed by psychological and technical floors around $2,100 and $2,000 if selling extends. On the upside, resistance sits near $2,350, with a stronger barrier in the $2,450–$2,500 area; a decisive move above those levels would be necessary to re-establish a bullish bias and revisit recent highs.
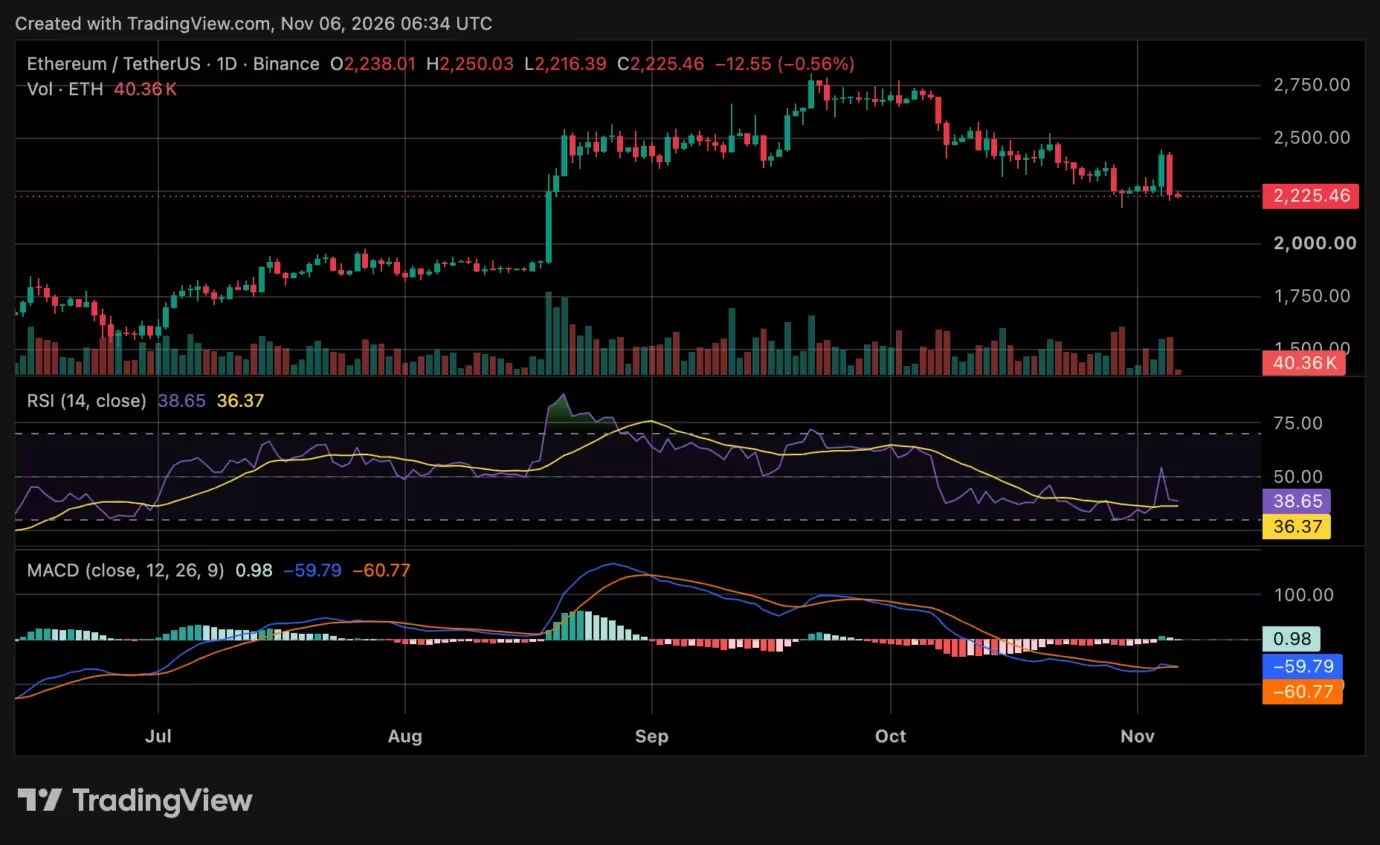
Ethereum price chart
What traders should monitor
- Daily flows into and out of spot ETH ETFs, which can rapidly shift liquidity conditions.
- Derivatives open interest and liquidation metrics to gauge leverage and forced selling risk.
- Exchange reserve trends to watch for supply changes driven by staking or custody flows.
- Macro headlines, especially around U.S. tech sector performance and interest-rate expectations, which tend to transmit into crypto markets.
Short-term traders and investors should combine on-chain data, ETF flow reports and technical indicators to form a cohesive view. A recovery that clears $2,350 would lift the odds of a retest of the $2,450 rejection zone. Conversely, a sustained drop under $2,200 could expose deeper support toward $2,000 and intensify bearish momentum.

Leave a Comment
Comments (1)
whoa ETH tanks hard. tech stocks + ETF outflows = perfect storm. $210m liquidations??? yikes. feels like forced selling, might be a buy for brave ppl