

Why Bitcoin is up today: a quick overview
Bitcoin reclaimed ground above the $80,000 mark on November 5 after dipping to near $75,600 during the U.S. midterm election count. The rebound was driven by renewed spot Bitcoin ETF inflows, a broader risk-on shift in U.S. markets and a sharp liquidation of bearish, leveraged positions that forced short sellers to cover. Institutional flows were mixed, but the combined catalysts pushed BTC higher and lifted major altcoins alongside it.
ETF inflows returned, but sentiment remains mixed
U.S. spot Bitcoin ETFs recorded roughly $74.6 million in net inflows on November 4, reversing three sessions of outflows and signaling a return of demand from institutional and retail ETF investors. Fidelity's FBTC led the way with an estimated $236.7 million of new money, while Bitwise's BITB and ARK Invest's ARKB added about $15.2 million and $19.9 million, respectively. Offsetting some of that buying, BlackRock's IBIT reported $201.2 million in withdrawals, illustrating that institutional flows are still uneven.
Before this shift back into ETFs, investors had pulled approximately $1.16 billion from U.S. spot BTC funds across three sessions: $643.2 million on October 30, $398.6 million on November 2 and $115.6 million on November 3. The November 4 inflows do not fully make up those prior outflows, but they do suggest appetite is returning after the recent selloff.
ETF inflows and institutional demand
Spot ETF flows remain an important short-term driver of BTC price action because they represent a relatively accessible vehicle for large asset managers and other institutions to put money into Bitcoin. When inflows accelerate, they can provide steady buy-side pressure that supports price. Conversely, heavy outflows can add to selling momentum. The partial recovery in fund flows on November 4 helped underpin the price bounce, even as investors continue to monitor which funds are attracting or losing capital.
Macro backdrop: elections, equities and the dollar
Bitcoin's climb coincided with a broader stabilization in financial markets after Democrats secured control of both chambers of the U.S. Congress. Initially, crypto traders feared that a Democratic sweep could bring stricter oversight on digital assets; but markets eventually swung higher as investors reassessed policy and risk appetite. The S&P 500 rose about 1.6% as stocks recovered, oil prices eased and the U.S. dollar weakened, while Treasury yields backed off — conditions that typically favor risk assets such as Bitcoin.

Short squeeze and liquidations amplified the rebound
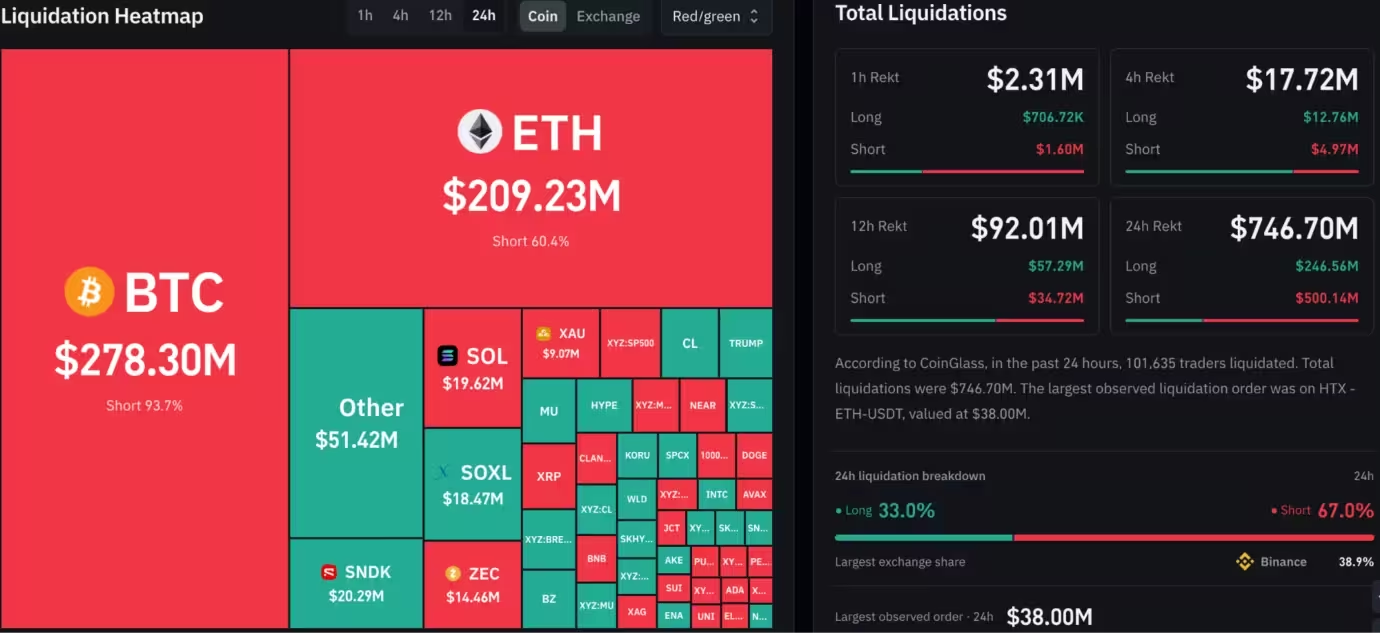
One of the most immediate accelerants to Bitcoin's bounce was a large short squeeze. CoinGlass data showed nearly $378 million in bearish crypto positions liquidated within a single hour. Over the same liquidation window, total forced liquidations reached almost $747 million. When heavily leveraged short positions are closed out, exchanges buy BTC to cover those bets, creating additional upward pressure that can rapidly amplify price moves.
Market performance across major tokens
The recovery extended beyond BTC. According to market data at press time, Bitcoin traded around $80,320, up more than 3% over 24 hours after its late selloff. Ethereum gained close to 6% to trade near $2,425; XRP rose roughly 3% to about $1.31; Solana climbed around 4% to near $96; and BNB moved up approximately 2% to about $710. Notably, Zcash outperformed many large-cap tokens, jumping more than 7% to nearly $1,320 on roughly $1.2 billion in 24-hour volume.
Technical picture: resistance, support and indicators
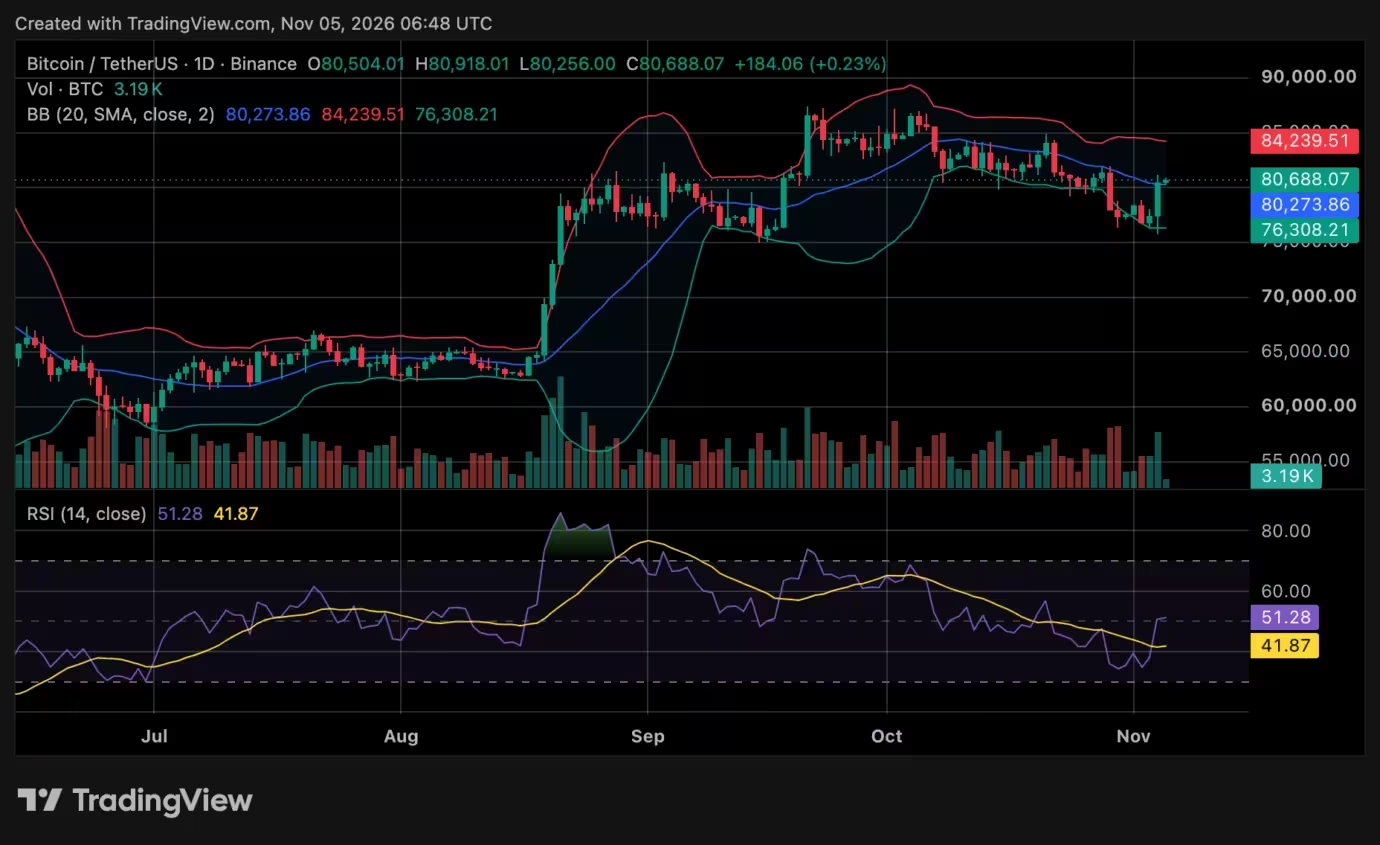
Bitcoin's short-term technicals show an improving momentum profile after the dip. BTC traded around $80,688, sitting above the middle Bollinger Band at about $80,274, a commonly watched short-term trend indicator. The Relative Strength Index (RSI) recovered to roughly 51.3, versus a moving average near 41.9, indicating buying pressure has returned but stopping short of overbought conditions. That leaves room for further moves in either direction.
Bitcoin price chart
Immediate resistance is clustered near $81,300 to $82,000; a sustained break above that zone could put the upper Bollinger Band near $84,240 into focus. On the downside, the middle band around $80,274 is the first support line, followed by the lower Bollinger Band near $76,308. Traders will be watching intraday volume and ETF flow updates closely to gauge whether this bounce has breadth or is mainly a short-covering move.

Key technical levels to watch
- Immediate resistance: $81,300 to $82,000 - Upper target on a stronger recovery: near $84,240 - Immediate support: middle Bollinger Band ~ $80,274 - Secondary support: lower Bollinger Band ~ $76,308
Analyst views: optimism and caution
Some analysts see the way BTC absorbed selling pressure as a bullish sign. One crypto commentator argued that the market's resilience suggests the cycle's low may already be behind us, though he assigned only a modest 16% probability that Bitcoin would set a new all-time high by July 2027, while leaving open the possibility of a record later in the year.
By contrast, CryptoQuant contributor CryptoZeno urged caution. He noted that the Bitcoin Cycle Extremes Index remains in a zone he labels Watch / Mild Pressure and that the Cycle Extreme Oscillator has not yet crossed the threshold associated with prior strong market recoveries. These readings indicate speculative activity has cooled but do not yet confirm a sustained market bottom. CryptoZeno highlighted that further consolidation or another leg down remains possible before a durable recovery gains traction.
Outlook: what traders and investors should monitor
Over the near term, market participants should monitor several key inputs: - Ongoing spot Bitcoin ETF flows and fund-level data, which can reveal where institutional demand is concentrating. - Short interest and liquidation heatmaps from derivatives platforms; another wave of forced liquidations could accelerate price moves. - Macro cues such as dollar strength, Treasury yields and equity market direction, which influence risk appetite. - Technical confirmations above $82,000 or renewed weakness back below the middle Bollinger Band around $80,274.
If ETF inflows continue and macro conditions stay supportive, BTC could extend its recovery and test higher resistance. Yet, if flows prove fleeting or macro risks reemerge, traders should be prepared for renewed volatility and potential retracements.
Bottom line

Bitcoin's climb back above $80,000 on November 5 reflected a confluence of factors: returning ETF inflows after a multi-day outflow episode, a market-wide rebound in equities and a sizeable short squeeze that forced leveraged bears to cover. While the technical picture now points to improved momentum, analysts remain split between cautious views that a deep correction may not be over and more optimistic takes that the selling pressure has been absorbed. For traders and investors, ETF flows, liquidation activity and macro signals will remain crucial gauges of how sustainable this rebound might be.

Leave a Comment
Comments (1)
Wait, ETFs show inflows but BlackRock pulled $201m? is this even real or just short squeeze noise... market looks messy, who’s tracking fund levels properly?