

Spot Bitcoin ETFs Reclaim Momentum as BTC Pulls Back
U.S. spot Bitcoin exchange-traded funds recorded more than $1 billion in net inflows across three consecutive trading sessions, marking a rebound after several weeks of outflows. The surge in ETF demand came even as Bitcoin (BTC) retraced from intraday highs near $85,000 and traded closer to $82,000 — underscoring ongoing institutional interest in crypto through regulated investment vehicles.
ETF Flow Details and Fund Leaders
According to SoSoValue’s ETF data, U.S. spot Bitcoin funds drew about $528 million on October 21, bringing combined inflows since Monday to roughly $1.08 billion and nudging October’s cumulative ETF flows back into positive territory.
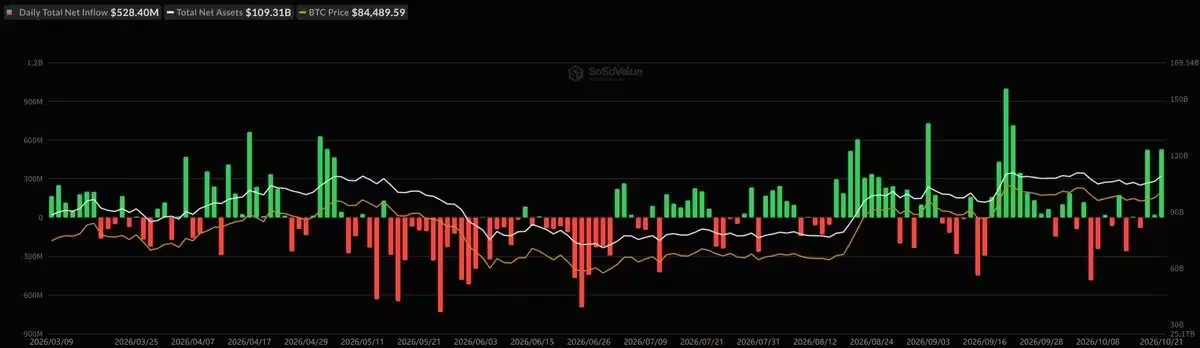
U.S. spot Bitcoin ETFs flows
Top performers
- BlackRock’s iShares Bitcoin Trust (IBIT) led Wednesday’s activity with approximately $235 million in net purchases.
- Fidelity’s Wise Origin Bitcoin Fund (FBTC) followed with roughly $212.7 million.
- Grayscale’s Bitcoin Trust added about $32.6 million while Bitwise’s BITB recorded near $19.2 million.
These inflows follow $526.7 million of net demand on October 19 and roughly $23.2 million the next session, reversing two challenging weeks that saw sizable redemptions. Products posted $228.4 million in withdrawals between October 12–16 and around $678.9 million the week before, including a single-day ETF outflow of $484.9 million on October 7 — the largest since June.
Crypto ETF Landscape: Ether, Solana and XRP Also See Renewed Demand
Investor appetite wasn’t restricted to Bitcoin exposure. U.S. spot Ether ETFs attracted about $15 million on Wednesday, ending a five-session streak of net withdrawals. Solana-linked funds logged about $585,000 in net purchases after 13 sessions of outflows, while XRP ETFs received roughly $709,000.
Although these inflows were modest compared with Bitcoin’s intake, the return to positive flows interrupted a period of broad selling across cryptocurrency investment products. Ether ETFs had been particularly weak earlier in the month; Ether products accounted for $320.1 million of combined losses during the week ending October 16.
How ETF flows are measured
Daily ETF flows reflect net capital entering or leaving funds through share creations and redemptions. These figures do not directly indicate whether investors expect price gains or specify how trades impact the broader spot market — rather they show how much capital managers are creating or redeeming in ETF shares.
Bitcoin Price Action and Technical Signals

Bitcoin climbed to an intraday high near $84,777 on October 21 before giving up some gains. By October 22, BTC traded around $81,963, down about 1.2% over 24 hours. Daily trading volume was near $37.2 billion, and BTC retained a 1.64% gain over seven days, according to market data.
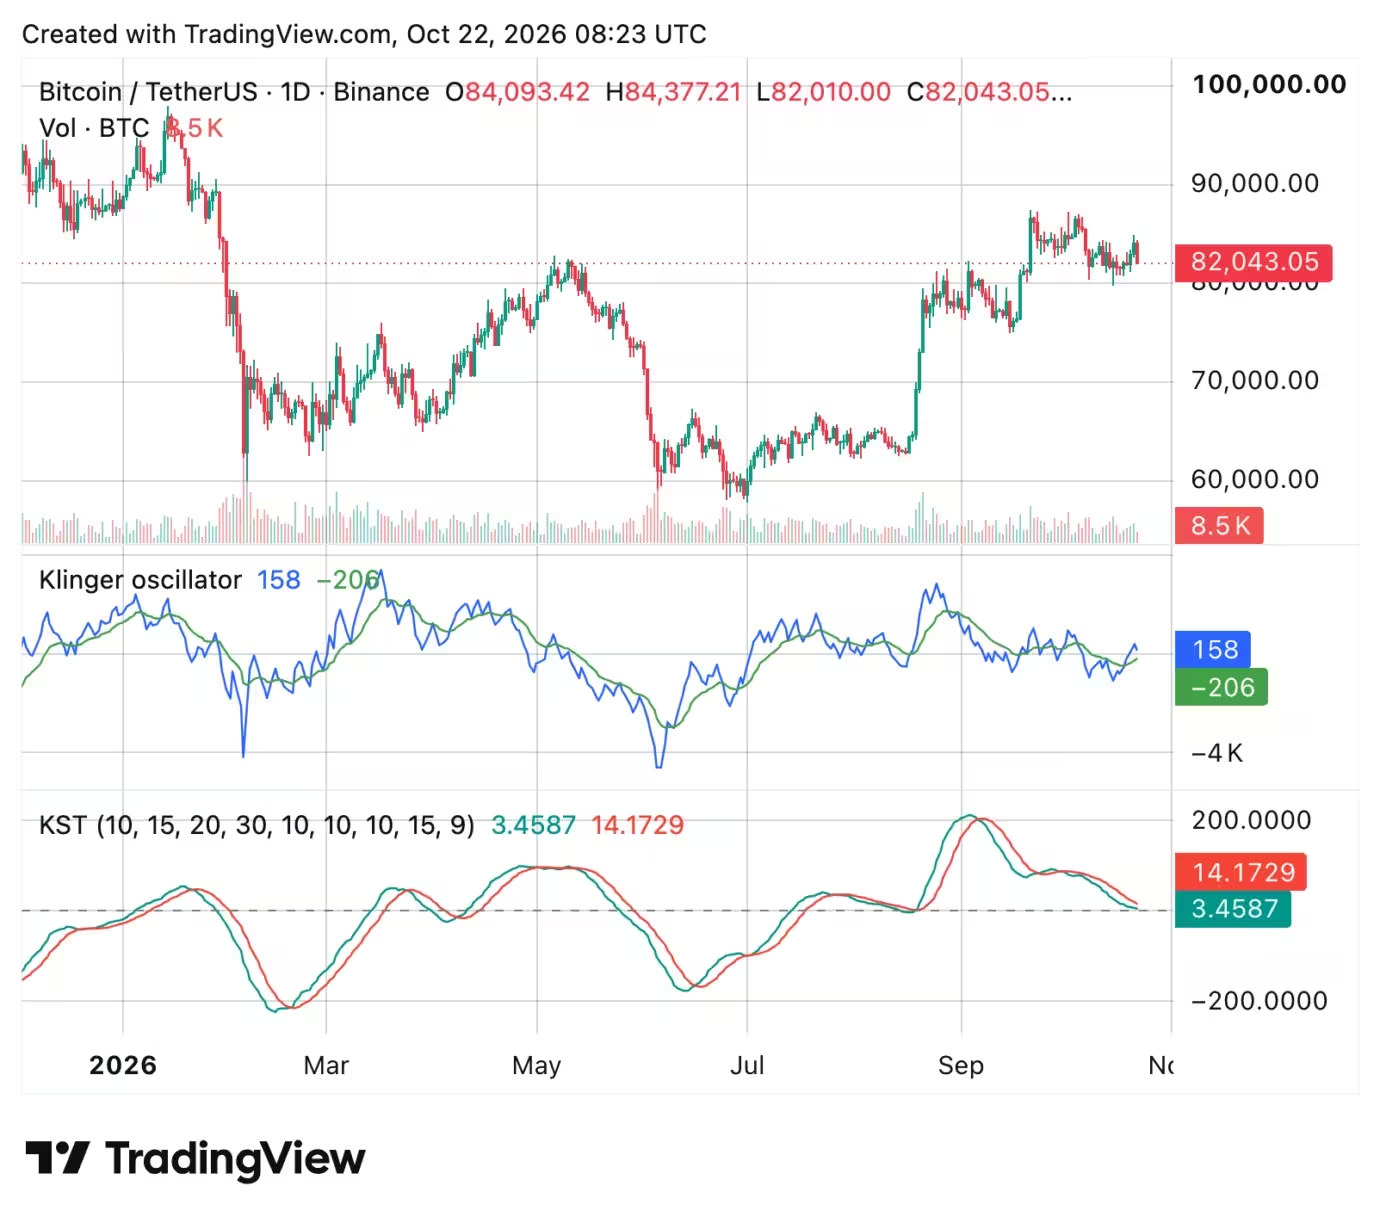
Bitcoin (BTC) price chart
Price action shows renewed resistance in the $85,000–$87,000 band, while immediate support sits near $80,000 and $78,000 if selling deepens. Technical indicators painted a mixed picture:
- The Klinger Oscillator was positive at 158, above its signal line, suggesting improving volume-driven buying activity.
- The Know Sure Thing (KST) indicator remained below its signal line, pointing to weaker medium-term momentum.
- Crypto analyst Ali Martinez flagged a TD Sequential sell signal near $85,000 that preceded a 2.8% correction; a subsequent buy signal surfaced near $82,000, indicating the pullback could be stabilizing but not guaranteeing a rebound.
Traders monitoring momentum oscillators and volume metrics will likely watch if ETF inflows can sustain buying pressure that overcomes the $85K resistance zone.
On-Chain Insights: Newer Whales Face Pressure
On-chain data from CryptoQuant highlighted contrasts in realized cost bases across investor cohorts. Analyst Amr Taha’s October 22 update showed:
- Binance deposit addresses: realized price around $64,200.
- Newer whales: average cost basis about $77,120 — roughly 6.3% below current prices near $82,000.
- Long-term whale holders: realized price roughly $46,400.
- Miner whales: realized price near $51,820.
These figures suggest newer, larger whale accumulators are sitting close to break-even and could be more sensitive to short-term downside. Additional on-chain metrics showed Bitcoin’s 365-day UTXO Block P/L Count Ratio at 13.6, a level comparable to November 2022 readings when BTC traded near $16,000. The 30-day realized capitalization change was a positive $12.93 billion, smaller than the $40 billion recorded in October 2025 and the $64 billion observed the previous July.
Why this matters
The contrast between ETF inflows and on-chain indicators reveals a bifurcated market: institutional demand via ETFs remains strong, yet some retail and newer large holders face limited profit buffers. If institutional inflows persist, they may provide price support; however, clustered break-evens among recent whales can amplify volatility during sharp pullbacks.
Outlook and Key Takeaways for Investors
- Institutional interest via U.S. spot Bitcoin ETFs has returned, with over $1 billion in net inflows across three days, led by IBIT and FBTC.
- Renewed flows into Ether, Solana and XRP ETFs interrupted a recent selling streak, though volumes were smaller versus Bitcoin.
- Technical indicators and TD Sequential signals point to a near-term consolidation range between $78,000 and $87,000, with immediate support at $80,000.
- On-chain data shows newer whales’ cost basis near current prices, suggesting limited cushion for that cohort.
For traders and long-term investors, the interaction between ETF demand, technical resistance, and on-chain holder composition will be critical. Continued inflows could underpin a renewed rally, but elevated break-even levels among newer whales and mixed momentum indicators mean risk management and position sizing remain essential.
Watch upcoming ETF flow reports and on-chain metrics closely; they will provide real-time clues about whether institutional accumulation can outpace profit-taking from shorter-term holders and whales.

Leave a Comment
Comments
No comments yet. Be the first.