

Why ETH slid on November 9
Ethereum price dropped more than 4% over 24 hours as a wave of leveraged long liquidations and renewed US spot ETF withdrawals intensified selling across crypto markets. Traders faced heavy forced selling in derivatives, while institutional flows into spot ETH products turned negative for the week, adding downward pressure to a market already sensitive to risk assets.
Key takeaways
- Ethereum experienced a 4% plus decline as long liquidations accelerated across derivatives. - CoinGlass recorded roughly $462 million in ETH liquidations in 24 hours, with long positions making up about $425 million (92%) and shorts about $37 million. - US spot ETH ETFs logged approximately $365.2 million in net outflows during the Nov 2 to Nov 6 trading week. - On-chain analytics firm Lookonchain flagged a full liquidation of a 56,667 ETH long position during the crash. - Technical resistance sits near $2,200 while near-term support is being watched around $2,100 and the $2,000 psychological level.

Liquidations drove forced selling
The most immediate catalyst for the drop was forced deleveraging in derivatives markets. When prices fall, traders using margin can quickly be margin-called and their positions closed by exchanges, creating cascading sell orders that further depress prices. Over the past day, CoinGlass data showed roughly $462 million of ETH positions were liquidated, with long liquidations accounting for the overwhelming majority.
Liquidations amplify moves in already fragile markets because closed leveraged long positions generate immediate market sell pressure. With Bitcoin also under stress, many cross-asset positions and correlated altcoins like ETH came under additional strain.
Notable large liquidation reported on-chain
One high-profile liquidation stood out. Lookonchain reported a trader lost their remaining 56,667 ETH long position — valued at about $118.4 million — as the market slid. Earlier monitoring had shown that the investor pared a larger 93,184 ETH exposure in October by selling 36,517 ETH to try to avoid a full liquidation, but the recent crash closed the remaining position.
Lookonchain attributed cumulative losses of about $44.78 million to that trader. Such large, public liquidations often feed into short-term panic and can delay rebounds until selling pressure subsides.
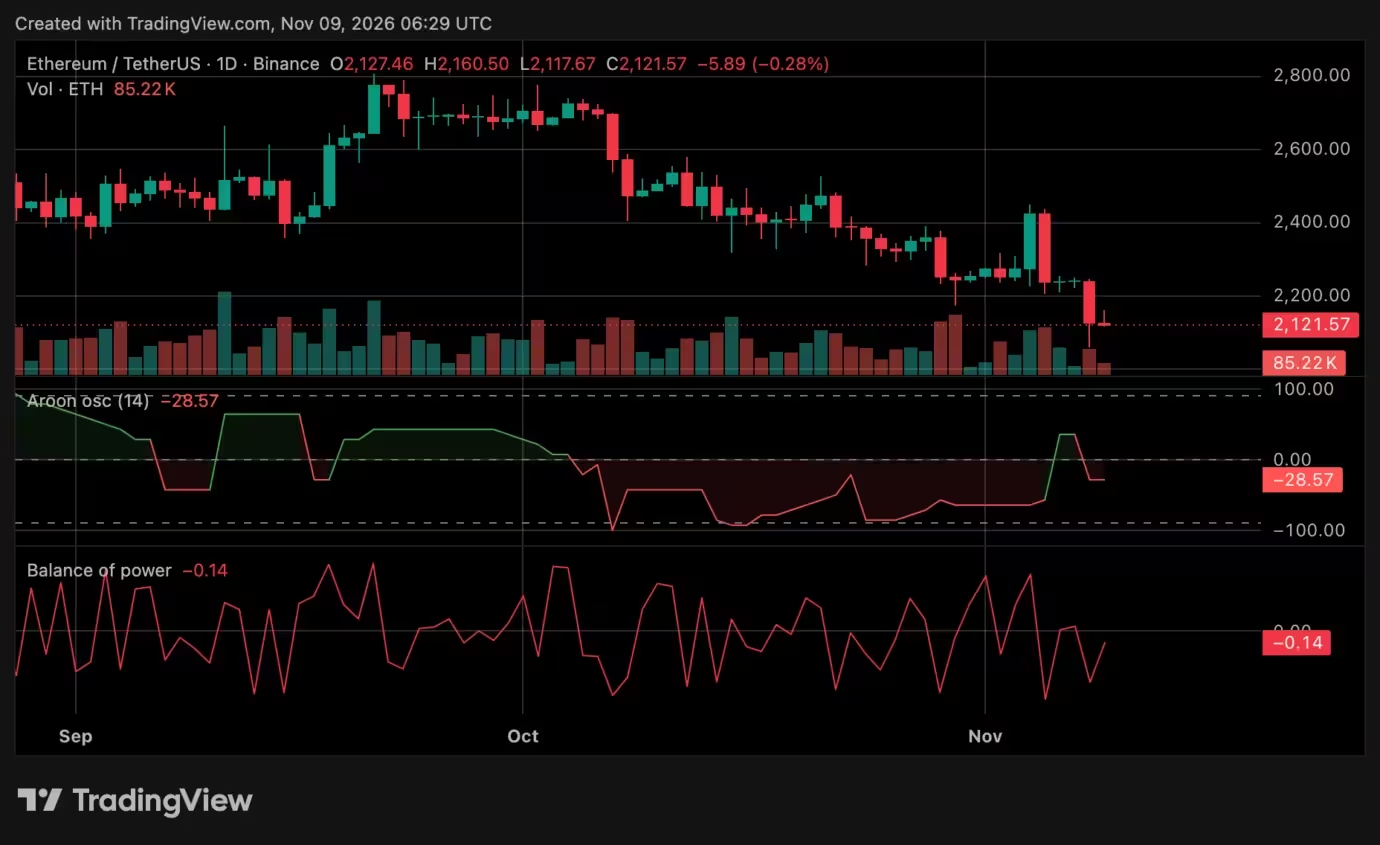
Ethereum price chart
ETF flows underline weaker institutional demand

Selling pressure extended beyond derivatives. According to Farside Investors, US spot Ethereum ETFs recorded about $365.2 million in net redemptions for the Nov 2–6 week. Monday saw $139.7 million withdrawn and Tuesday $85.3 million, followed by a brief Wednesday inflow of $53 million. The recovery was short-lived as Thursday and Friday showed $99.9 million and $93.3 million of outflows, respectively. BlackRock's ETHA alone accounted for $90.8 million of Friday’s redemptions.
Over the five trading sessions, combined Bitcoin and Ethereum ETF withdrawals were reported at roughly $1.65 billion, underscoring a pullback in some institutional allocation flows that had supported prices earlier in the year.
Institutional derivatives positioning also reflected heightened caution. Andreja Cobeljic, head of derivatives trading at AMINA Bank, has previously noted that ETF demand is an important barometer of institutional buying, while futures activity can be more speculative and does not always reflect long-term bullish conviction.
Market context: broader crypto weakness
Ethereum’s downside momentum came amid a wider slump in risk assets. Bitcoin traded near $75,200 during the session, while other altcoins such as XRP and Solana remained under pressure. A drop in US tech stocks and the Nasdaq fed into risk aversion that often affects crypto prices.
ETH has been sliding since peaking near $2,800 in late September. Several recovery attempts failed to reclaim prior highs, putting ETH into a lower-high, lower-low structure. The recent break under $2,200 reinforced that pattern, with traders watching $2,100 as near-term support and $2,000 as the next key psychological floor.
Technical outlook and indicators
Technical indicators remain tilted toward sellers, but oversold readings mean a bounce is possible once liquidation-driven selling subsides. The Relative Strength Index was reported near 32.94, approaching the conventional oversold threshold of 30. The Aroon Oscillator stood around -28.57 and the Balance of Power indicated continued selling at about -0.14.
On-chain and wave-count analysts have mapped downside target zones and potential reversal criteria. One analyst, More Crypto Online, suggested a downside target range between $1,832 and $2,069. According to that view, a decisive break above the channel upper boundary or a move above $2,255 would be an early signal that a short-term bottom could be forming.
Immediate resistance zones to watch are $2,200 and $2,400. If ETH loses the $2,100 area decisively, the $2,000 region will likely return to focus and could trigger further selling from momentum-based accounts. Conversely, a sustained recovery above $2,255 would raise the odds of a corrective rebound toward prior highs.
What traders and investors should watch next
- ETF fund flows: The next set of weekly ETF flow figures will be closely watched for signs of resumed institutional demand or continued withdrawals. - Liquidation levels: A reduction in leveraged long liquidation events would ease near-term downward pressure. - Technical breakouts: A move above $2,255 would be the first technical clue of a possible short-term bottom; failure to hold $2,100 would keep bears in control. - Macro risk sentiment: US equities and macro headlines remain meaningful drivers for crypto risk appetite.
Bottom line

Ethereum's drop on November 9 was driven by forced liquidations and renewed outflows from US spot ETH ETFs amid broader weakness in risk assets. Short-term technicals favor sellers, but oversold indicators and significant buying interest at lower price bands mean a rebound is possible if liquidation pressure eases and ETF flows stabilize. Traders should monitor fund flows, open-liquidation data, and key price levels near $2,100 and $2,255 for directional clues.

Leave a Comment
Comments
No comments yet. Be the first.