

Bitcoin hovers near $75,000 as recovery stalls
Bitcoin traded around $75,800 on Nov. 6 as intraday momentum weakened and buyers worked to defend the $75,000 level. After a short-lived rebound above $76,000 earlier in the day, BTC slipped back below that threshold, leaving the market to decide whether a sustainable recovery to the $81,000–$82,000 zone is still feasible.
Daily technical picture: Bollinger Bands and RSI
On the daily chart, Bitcoin remains situated near the lower Bollinger Band, with the middle band at $79,759.25 and the upper band at $84,433.20. The lower band sits at $75,085.29, placing the current price close to intraday support. The daily relative strength index (RSI) reads 37.82, below its short-term average of 40.42, which signals weaker buying pressure but stops short of the classic oversold threshold at 30.
A move back to the middle Bollinger band would require roughly a 5.2% gain from the press-time price of $75,798.85. Clearing that band would push BTC back toward the $80,000 region, a level that previously failed to hold after a late-October rebound.
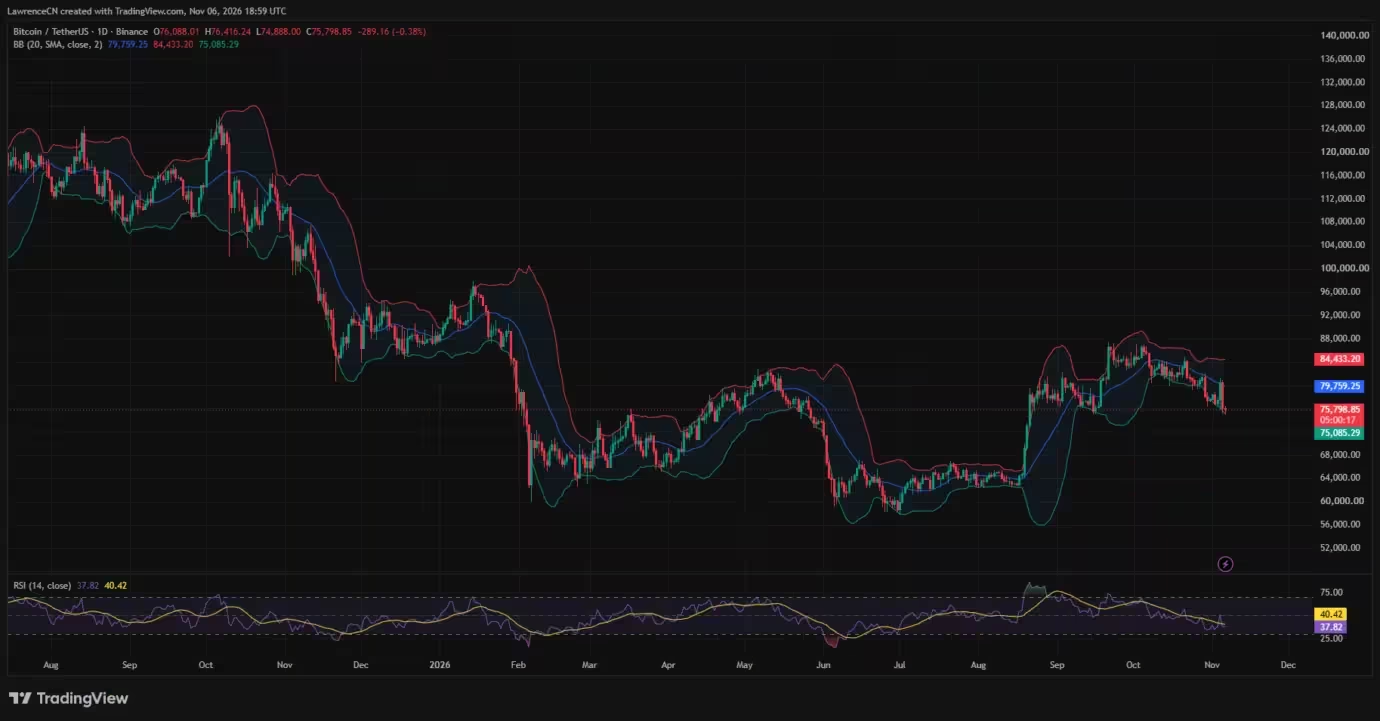
Bitcoin price daily chart — Nov. 6
Weekly dynamics: pivot points and momentum
The weekly candle showed wider swings: the session saw a high near $81,196 before retreating to a low near $74,888. At the time of reporting, BTC was roughly 3.26% below the weekly open of $78,354.01 and sat just above the $75,000 Murrey Math pivot. The next Murrey Math levels lie at $87,500 to the upside and $62,500 to the downside, but nearer-term liquidation and moving-average levels are more actionable for traders.
The Awesome Oscillator remains positive at 8,074.52, though the most recent bars have turned red, indicating a drop in bullish momentum. With the weekly candle still open for more than two days at the snapshot, the market may yet close decisively above or below the pivot.
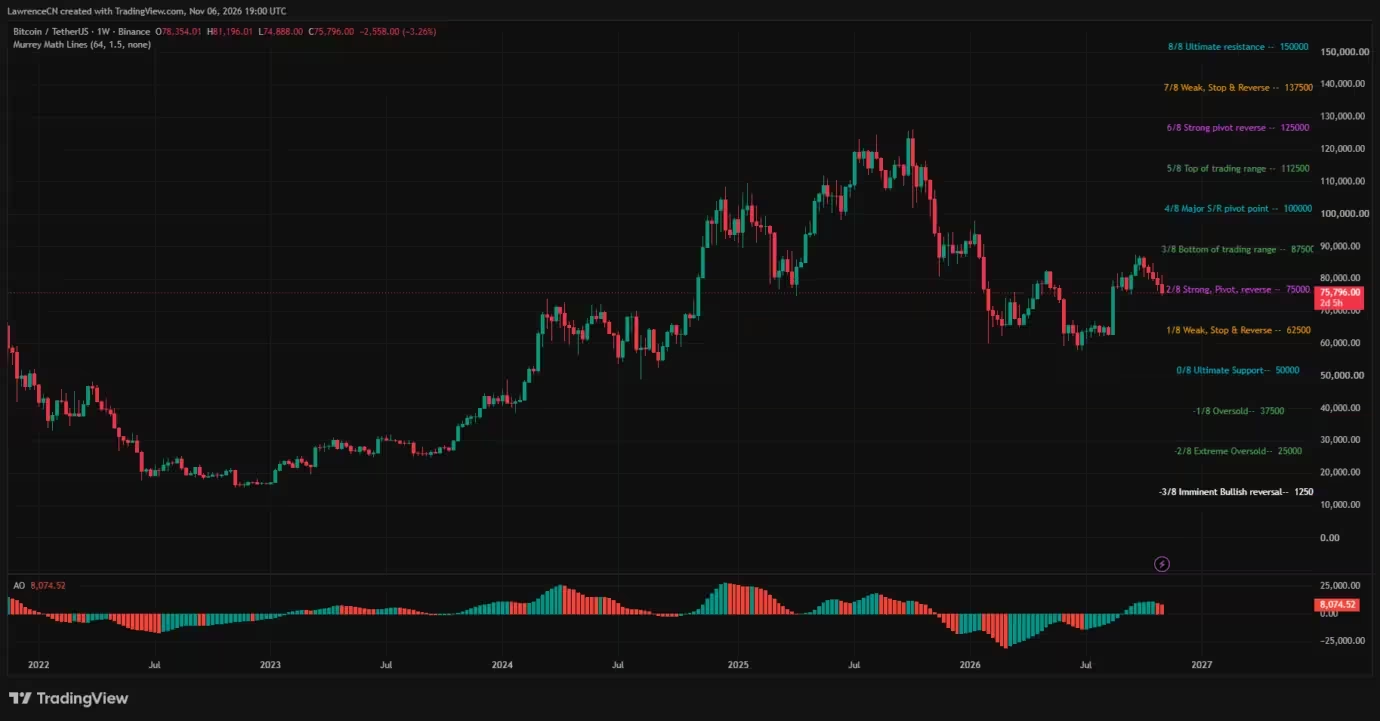
Bitcoin price weekly chart — Nov. 6
Leverage and liquidation heatmap: overhead and floor clusters
Liquidation maps show significant concentrations of leveraged orders both above and below the market, creating a precarious environment for directional bets. CoinGlass's 24-hour heatmap highlighted clusters overhead near $76,300, $76,600, and a range around $76,900–$77,100. Below spot, clusters appeared near $74,800 and across $74,500–$74,700. These pockets mean a move higher could trigger short squeezes, while renewed selling through support could cascade into long liquidations.

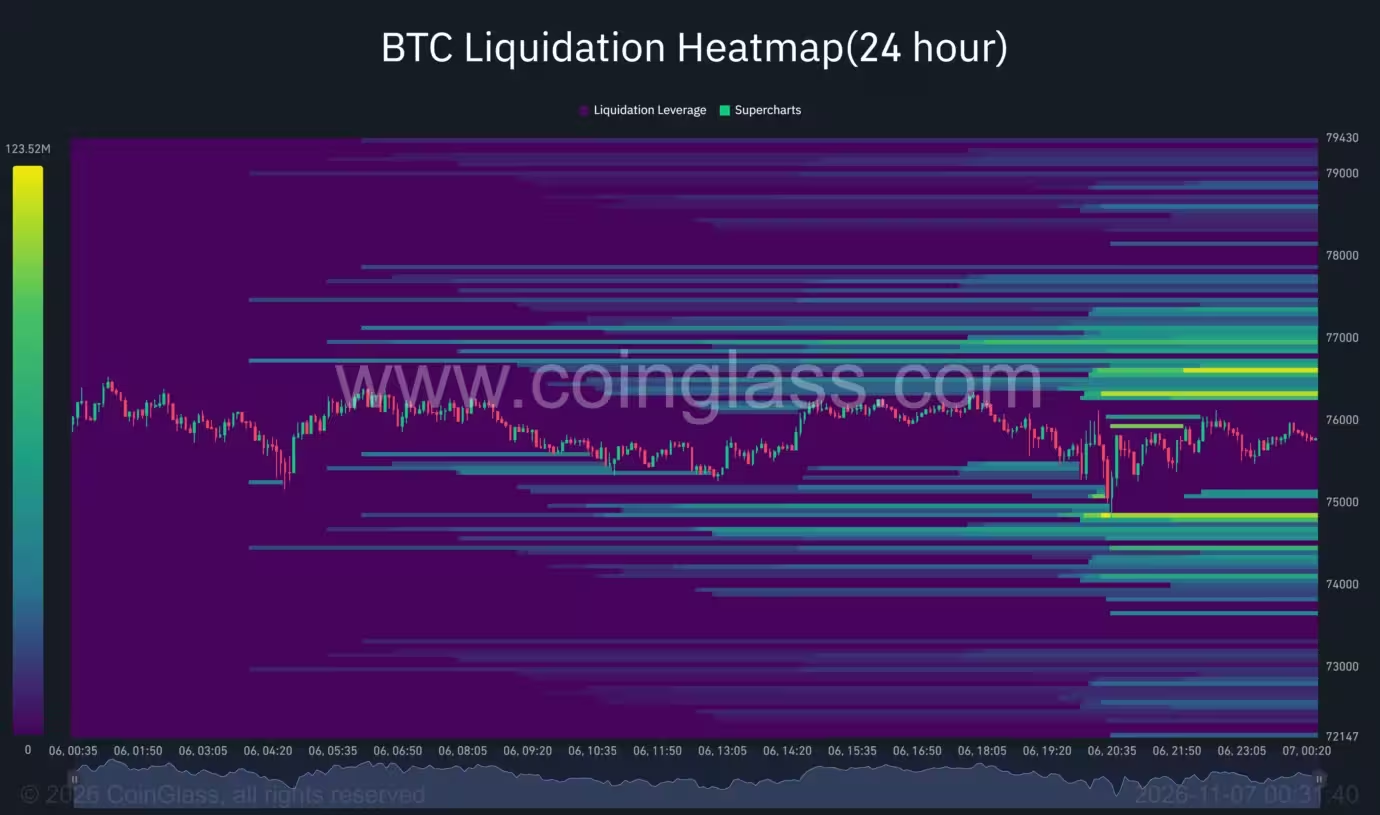
Bitcoin liquidation heatmap
Order-book and scenario analysis from on-chain analysts
On Nov. 6 analyst Ted Pillows noted strong buy interest concentrated between $73,000 and $75,000, while larger sell orders were positioned further out at $81,000–$82,000. Based on this order-book view, Pillows argued the downside may now be limited and that a rapid pump could occur if demand remains firm around current levels. From $75,798.85, reaching $81,000 would require about a 6.9% run, while $82,000 would need roughly an 8.2% advance.
Conversely, Crypto Patel sketched a deeper pullback into the $68,000 area before a more meaningful recovery materializes. That scenario leaves room for additional downside pressure before bulls can reassert control, highlighting the importance of risk management around these support bands.
Spot ETF flows: withdrawals pressure market liquidity
Weakness around $75,000 coincided with renewed outflows from U.S. spot Bitcoin ETFs. On Nov. 5 the funds reported $430.2 million in net withdrawals, reversing the prior session's $74.6 million of inflows. Fidelity's FBTC led redemptions with $199.9 million out, followed by $105 million from BlackRock's IBIT.
The withdrawal pattern followed a brief return to net buying on Nov. 4—when Fidelity took in $236.7 million even as BlackRock saw $201.2 million exit—and a larger sell-off on Oct. 30 that marked the end of a late-October inflow streak. Across Nov. 2–5, US spot ETF flows aggregated to $869.8 million in net outflows, with notable losses in Grayscale's GBTC (-$49.9M), Franklin Templeton's EZBC (-$32.9M), and VanEck's HODL (-$23.6M).
ETF withdrawals can reduce immediate market liquidity and magnify price reactions, particularly in a market already carrying concentrated leverage around key levels.
What traders should watch next
Key levels to monitor:
- Immediate support: $75,000 and the lower Bollinger band near $75,085.
- Short-term resistance: $76,000–$76,900 overhead liquidation clusters.
- Breakout targets: reclaiming the daily middle band near $79,760, with $81,000–$82,000 as the next significant supply zone.
Momentum indicators, liquidation heatmaps, and daily ETF flows will likely dictate the near-term bias. If buyers can hold the $73,000–$75,000 zone and absorb overload from overhead offers, a squeeze higher toward the $81K–$82K region is plausible. But if leverage-driven selling pushes BTC below the clustered support zones, a deeper retracement toward $68,000–$70,000 becomes a credible alternative.
Traders should combine technical signals with order-book and ETF flow data when sizing risk; concentrated liquidations on either side of the market mean swings can be exaggerated and rapid. For investors focused on longer-term allocation, temporary volatility around these levels may represent entry opportunities, but position sizing and stop placement remain essential in the current environment.


Leave a Comment
Comments (1)
Is the ETF outflow really the main driver here? Or is it just leverage and stop hunts? Feels shaky, 75k looks like a glass floor, could crack fast…