5 Minutes
Market snapshot: SOL shows renewed institutional interest
Solana (SOL) has flashed several technical and on-chain signals that suggest the token may be poised for a fresh rally. At press time SOL was trading around $212.39 — roughly 10.6% above its September low and more than 100% up from this year’s bottom — as institutional demand and derivatives positioning signal a possible shift in momentum.
Key support flip underpins bullish case
On the weekly chart, Solana has flipped the historic $204–$206 range from resistance into support. That band has repeatedly capped price advances over the past four years, so turning it into a floor is a noteworthy technical development for traders watching SOL and altcoin market structure.
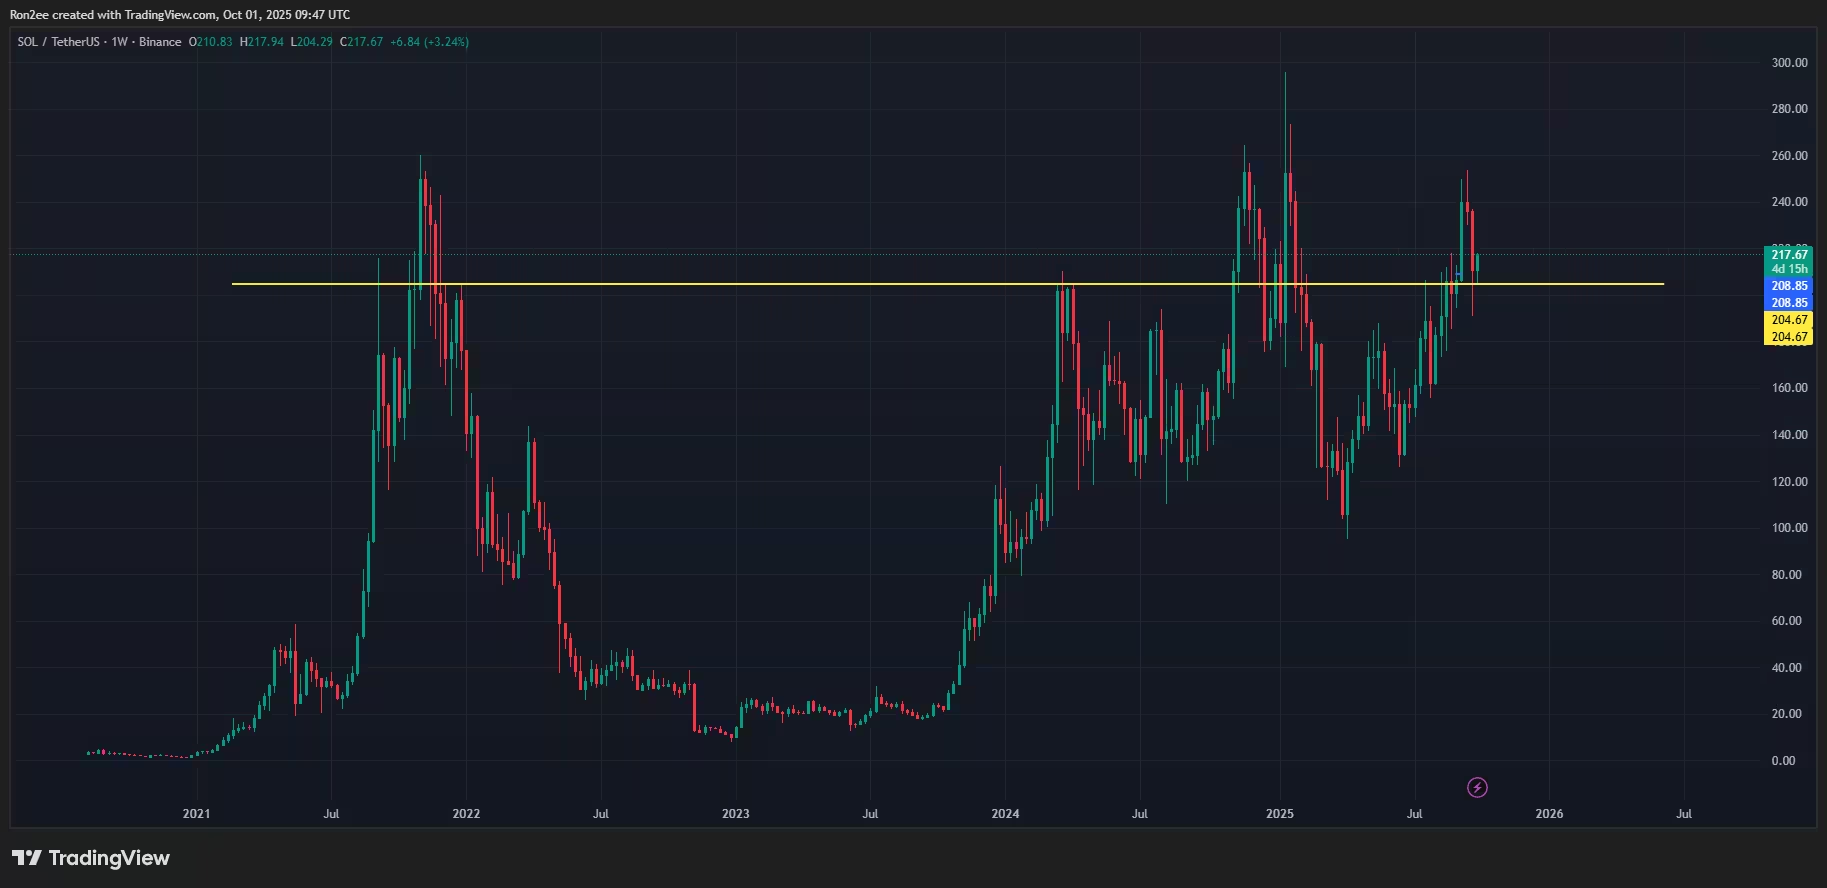
Solana price has flipped a multi-year key resistance level into support — Oct. 1
Smart money accumulation
Blockchain analytics from firms like Nansen indicate that so-called smart money — institutional and professional traders with a track record of profitable moves — has begun to accumulate SOL. These investors often set the tone for broader market flows; their accumulation can encourage retail traders and momentum-driven funds to follow suit, expanding liquidity and upward pressure on price.
Derivatives flow and the short-liquidation setup
Derivatives data back the accumulation thesis. The CoinGlass liquidity heatmap shows dense clusters of short-liquidation bands around the $213–$219 zone, concentrated just above current market levels. Below the spot price the heatmap cools, indicating fewer long-liquidation clusters. This asymmetry means that a bullish push could trigger a short squeeze, forcing short positions to liquidate and accelerating any breakout.
Short squeeze potential
Because many shorts sit just above spot, even modest buying pressure could cascade into rapid forced buying from liquidations. Traders and risk managers should monitor open interest and liquidation bands closely, as those metrics will determine the magnitude and speed of any squeeze.
ETF catalysts and institutional demand
Market participants are increasingly optimistic about a potential U.S. Solana ETF. The Securities and Exchange Commission’s streamlined review process for crypto ETFs has improved sentiment around approval odds. An SOL ETF would likely create a regulated on-ramp for institutional capital, boosting demand and liquidity — two factors that historically support sustained price gains for crypto assets.
Technical analysis: cup-and-handle forming
Technically, Solana looks constructive. The weekly chart shows a multi-year cup-and-handle structure: a deep U-shaped trough followed by a shallower handle. If SOL breaks above the pattern’s neckline, it would typically validate a larger bullish continuation. Currently, SOL sits about 20% below the $260 neckline that would confirm a breakout.
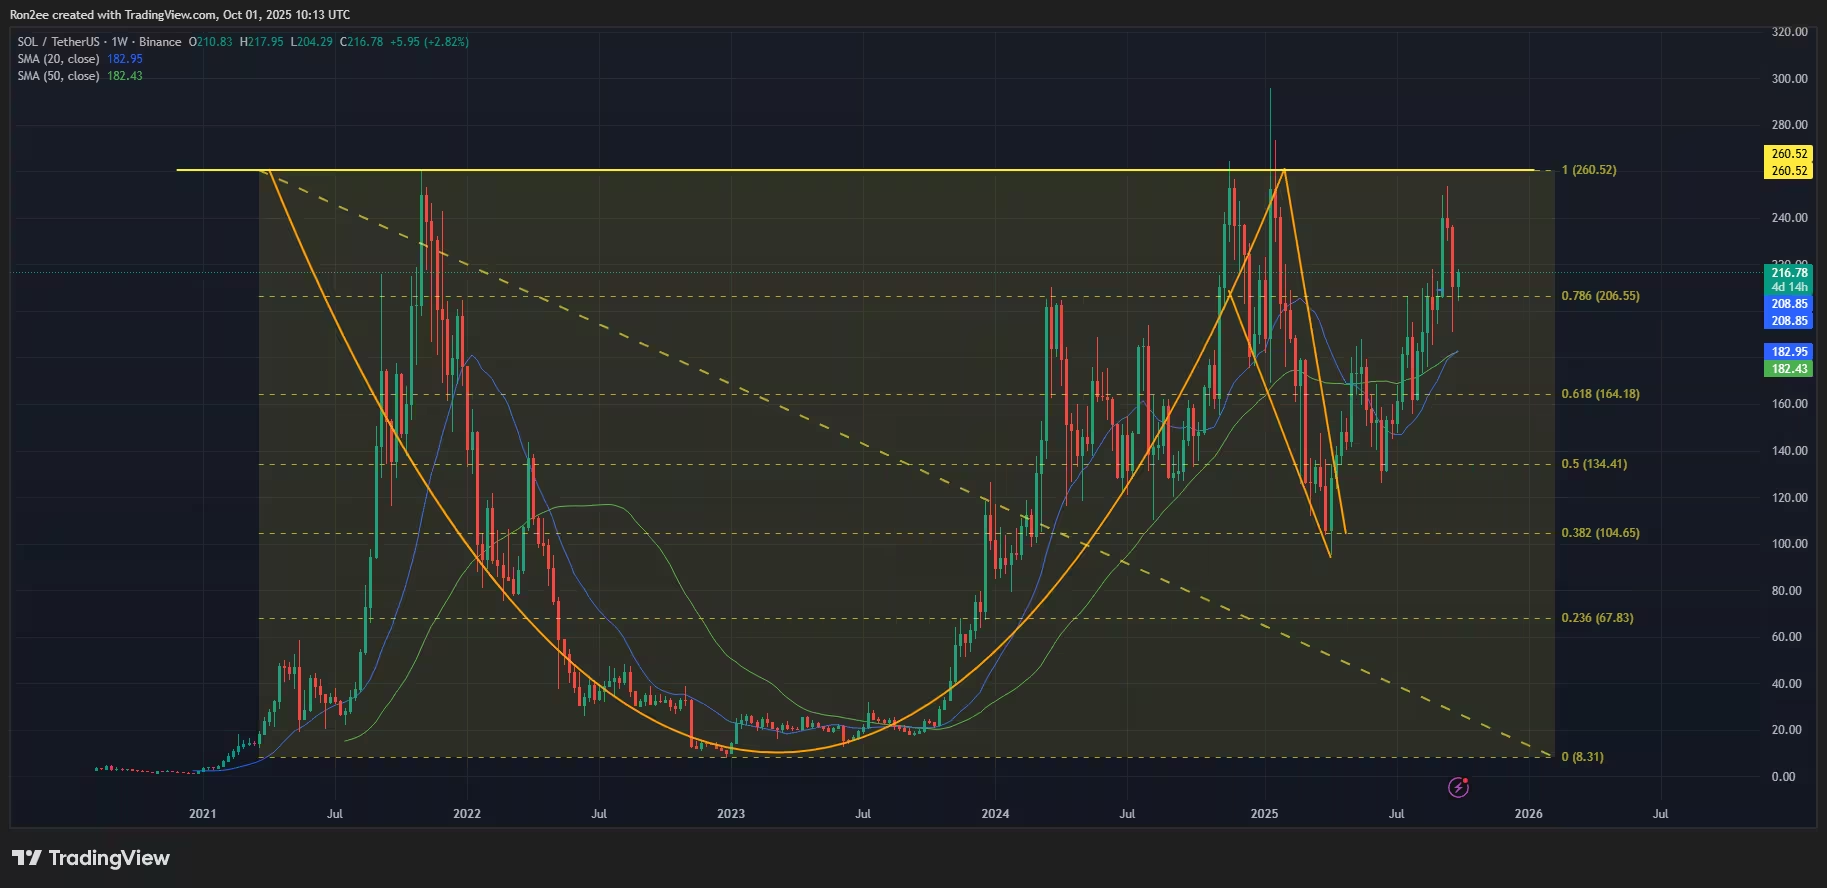
Solana price has formed a multi-year cup and handle pattern on the weekly chart — Oct. 1
Moving averages and momentum
The 20-week simple moving average is approaching a bullish crossover with the 50-week SMA, suggesting improving momentum on higher timeframes. On the daily chart, the Relative Strength Index (RSI) sits near 50, leaving room before overbought levels. The MACD line is edging toward a positive crossover, which many traders interpret as an early signal that bulls are regaining control.
Critical levels to watch and risk management
Key price levels define the near-term outlook. The $204 support zone is critical: a confirmed break below it would invalidate the current constructive pattern and expose SOL to deeper retracement, particularly since that cost area aligns closely with the 78.6% Fibonacci retracement level on longer timeframes. Conversely, reclaiming and holding above the $213–$219 short-liquidation band would increase the odds of a squeeze and quick move toward the $253 September high and ultimately the $260 neckline.
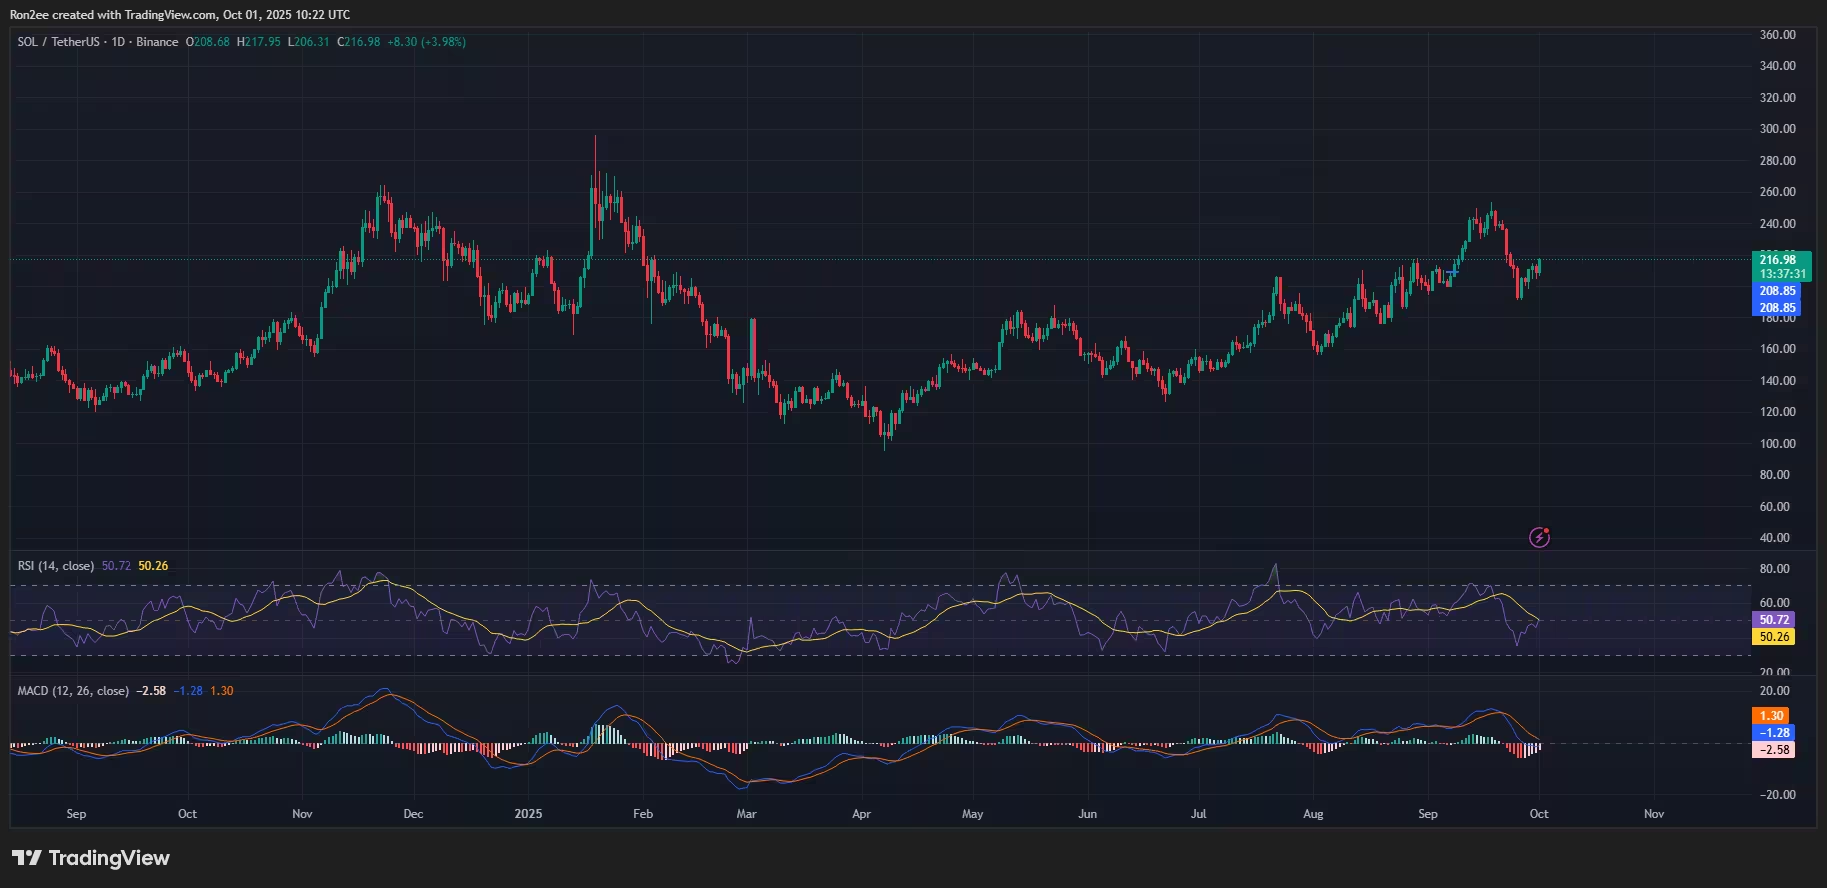
Solana MACD and RSI chart — Oct. 1
Outlook: cautious optimism
Between renewed institutional accumulation, a supportive derivative structure, and a classic technical breakout pattern, the case for a SOL rally is credible. Still, traders should remain disciplined: watch weekly support levels, manage position sizing, and pay attention to ETF headlines, macro liquidity conditions, and broader crypto market correlation, which can all amplify or derail a SOL-specific setup.
In summary, Solana’s blend of on-chain demand, derivatives positioning, and improving technicals creates a favorable environment for upside if key support holds. Confirmation above the $260 neckline would likely shift the narrative toward a sustained bull phase, while a breakdown below $204 would significantly raise downside risk.
Source: crypto
Leave a Comment