
5 Minutes
BNB tumbles from all-time highs — what traders should expect
BNB, Binance's native token, has pulled back sharply after a recent surge to new all-time highs. The token has corrected roughly 12% from peak levels, mirroring broader risk-off sentiment across the crypto market. Short-term technical signals point to a likely pullback, but the longer-term structure still favors bulls unless key support levels break.
BNB currently trades notably below its highs, reflecting profit-taking and a cooling of bullish momentum. Market participants are watching daily and weekly indicators — especially the relative strength index (RSI) and moving averages — to determine whether this decline is a consolidation or the start of a deeper correction.
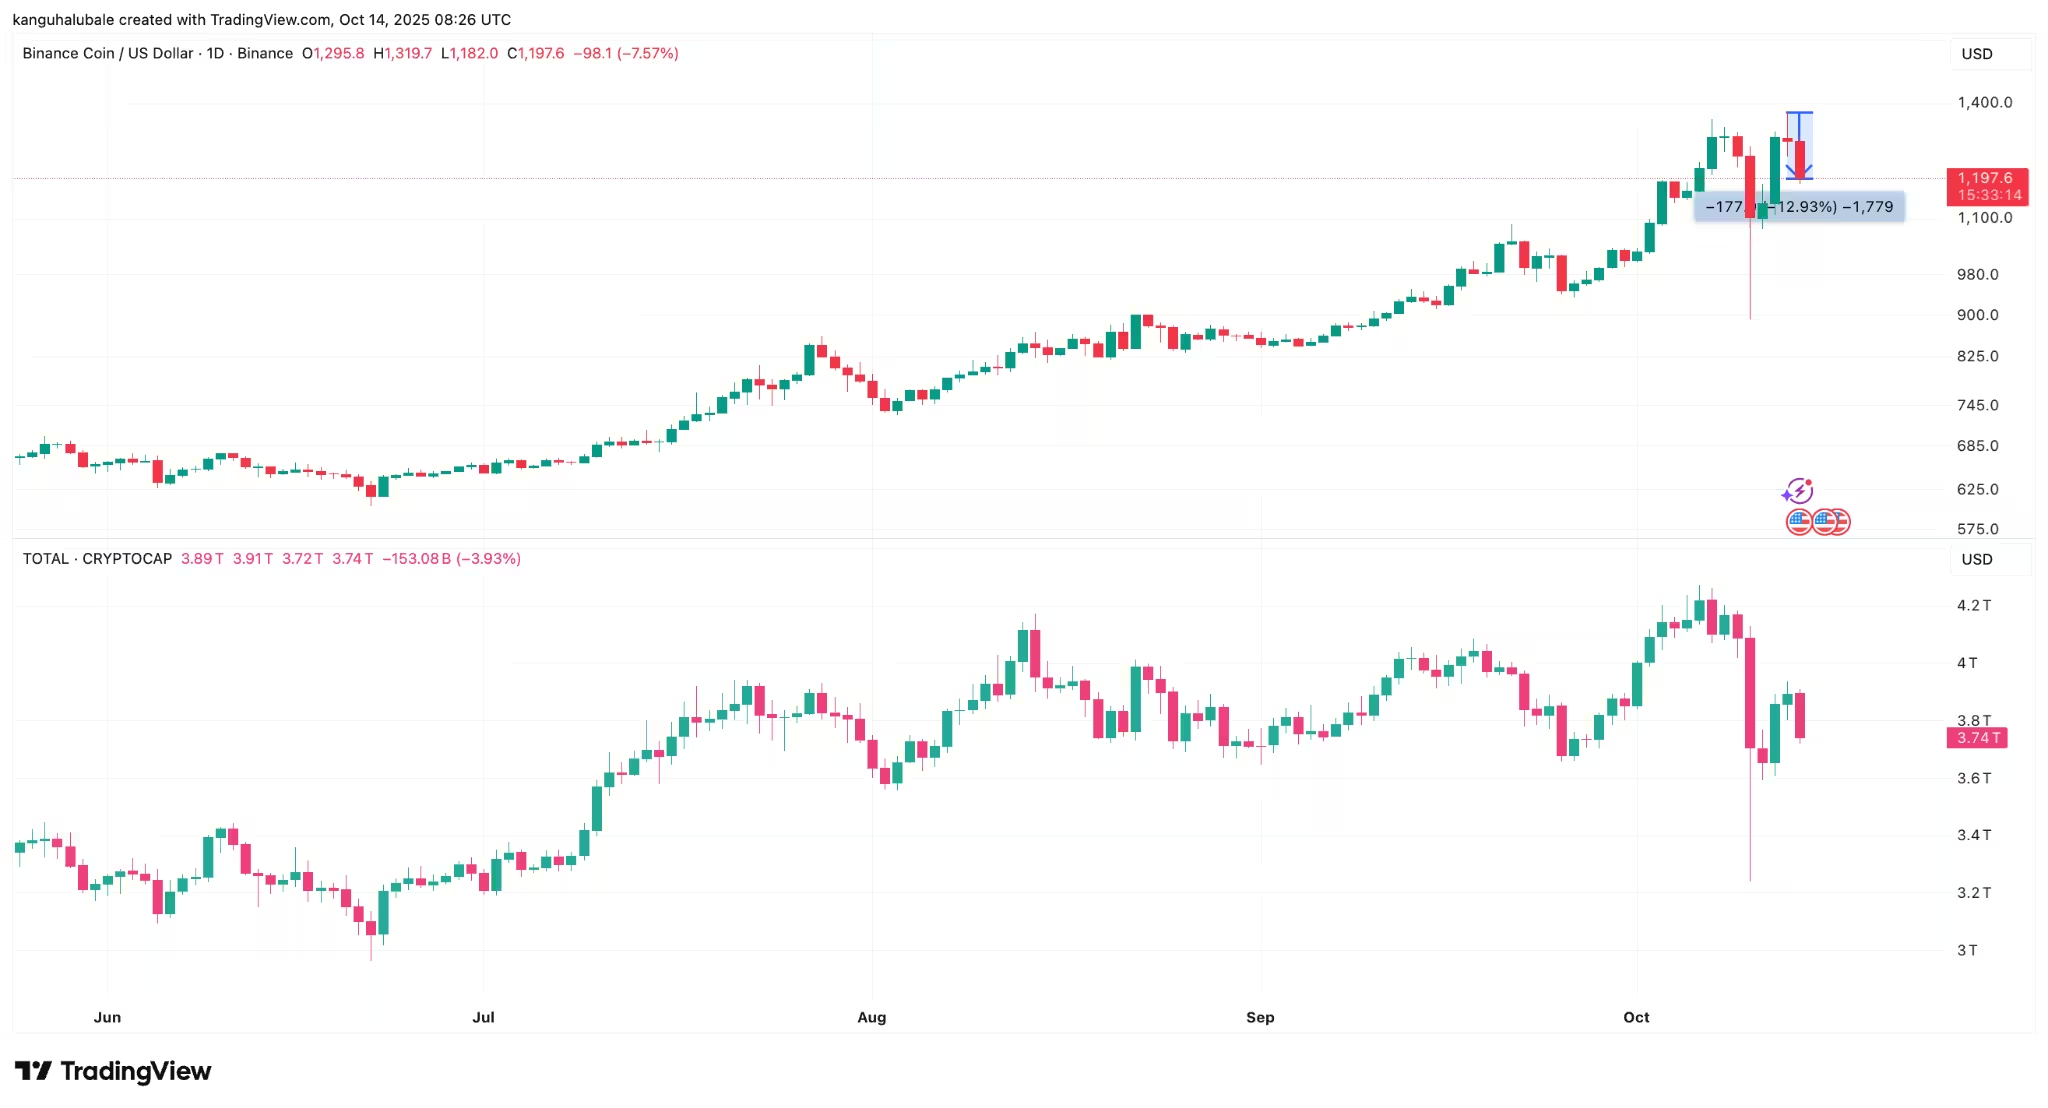
BNB/USDT daily chart
Why the RSI and bearish patterns matter
The weekly RSI pushed into overbought territory during the latest rally, signaling elevated risk of a short-term retracement. After topping around an 81 reading last week, the RSI has eased but remains high, suggesting that the market could see additional volatility.
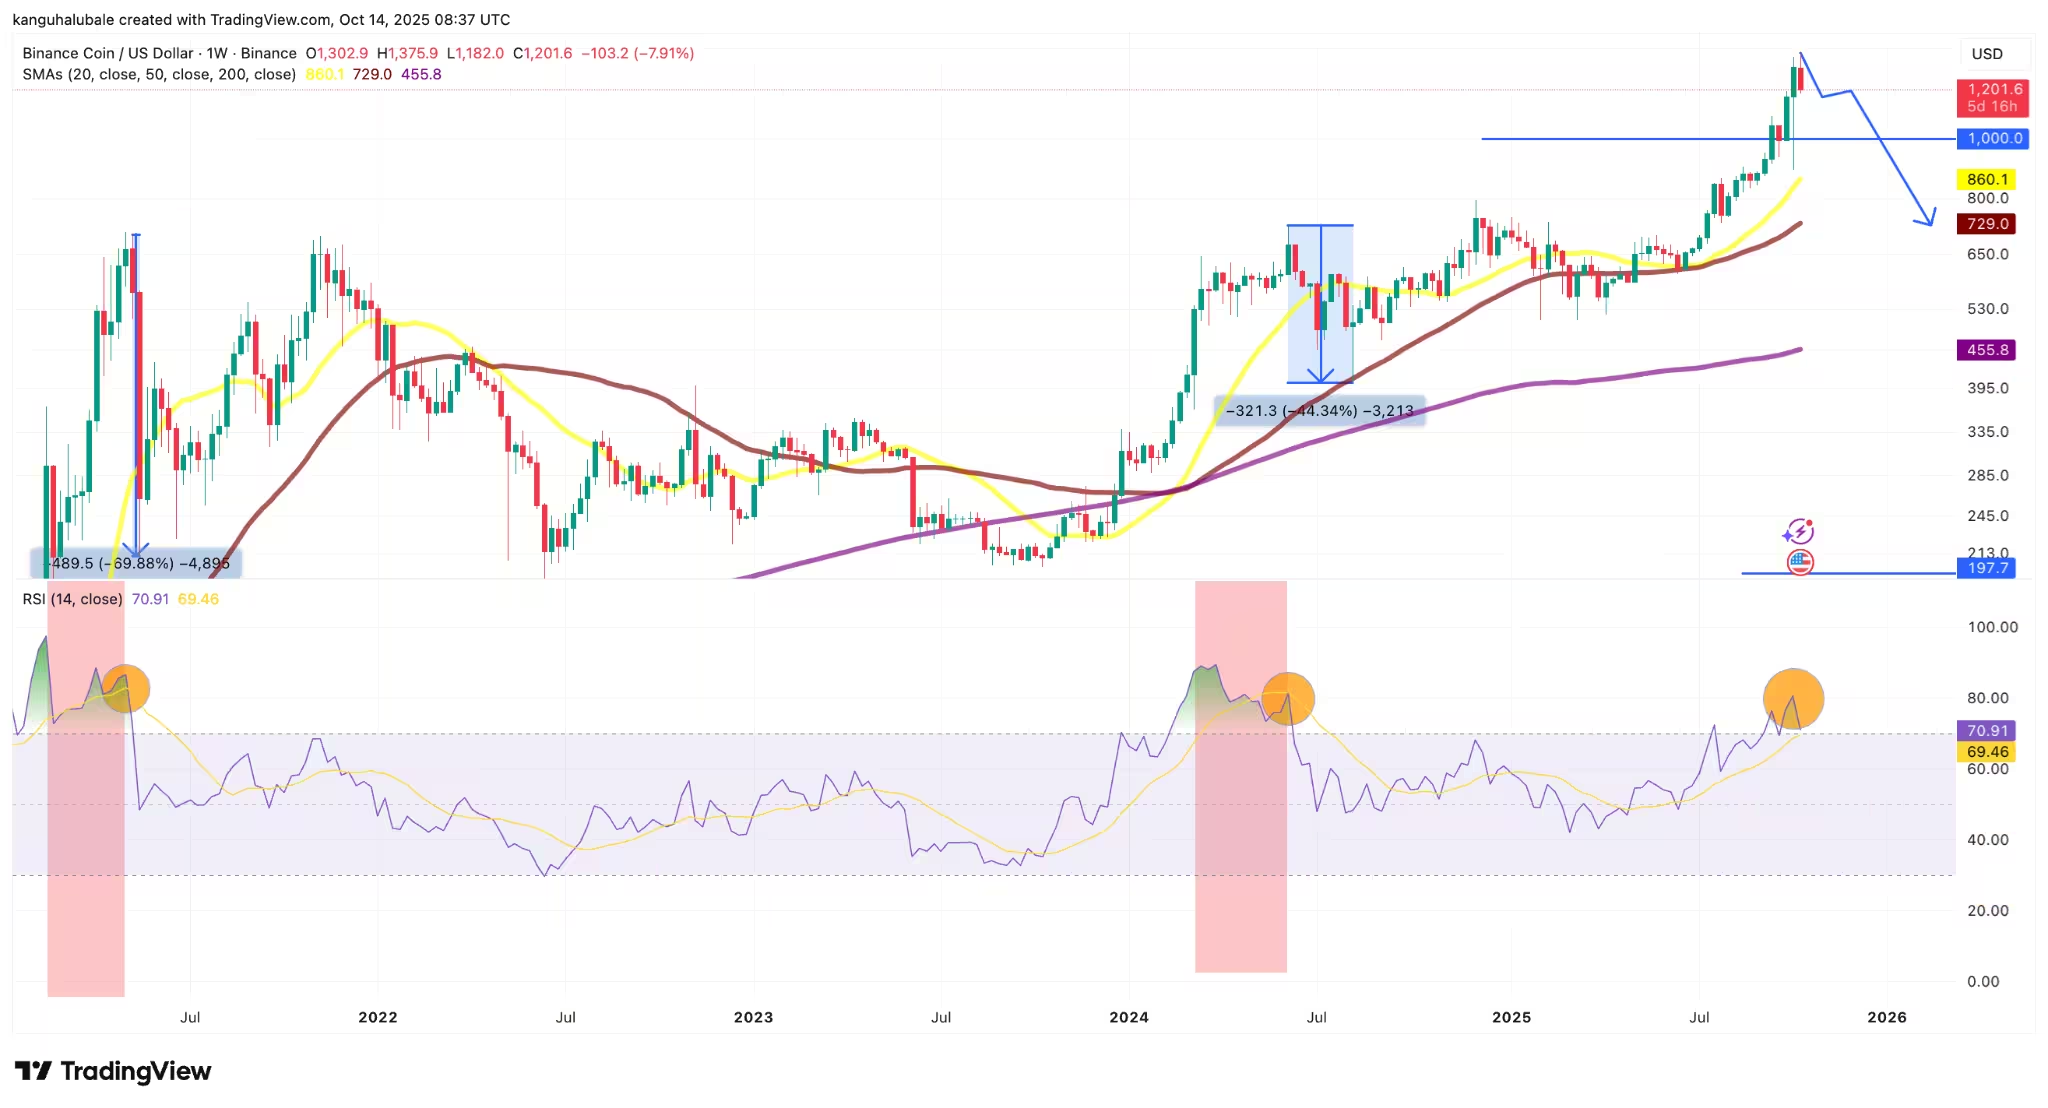
BNB/USD weekly chart
Technical indicators and short-term targets
On shorter time frames, BNB formed bearish clues such as a double-top pattern and a bearish divergence between price and the RSI. When price makes higher highs while the RSI prints lower highs, it typically indicates waning buying pressure and increases the odds of profit-taking. A return to the double-top neckline would put the $1,000 area in focus, representing a meaningful drop from current prices.
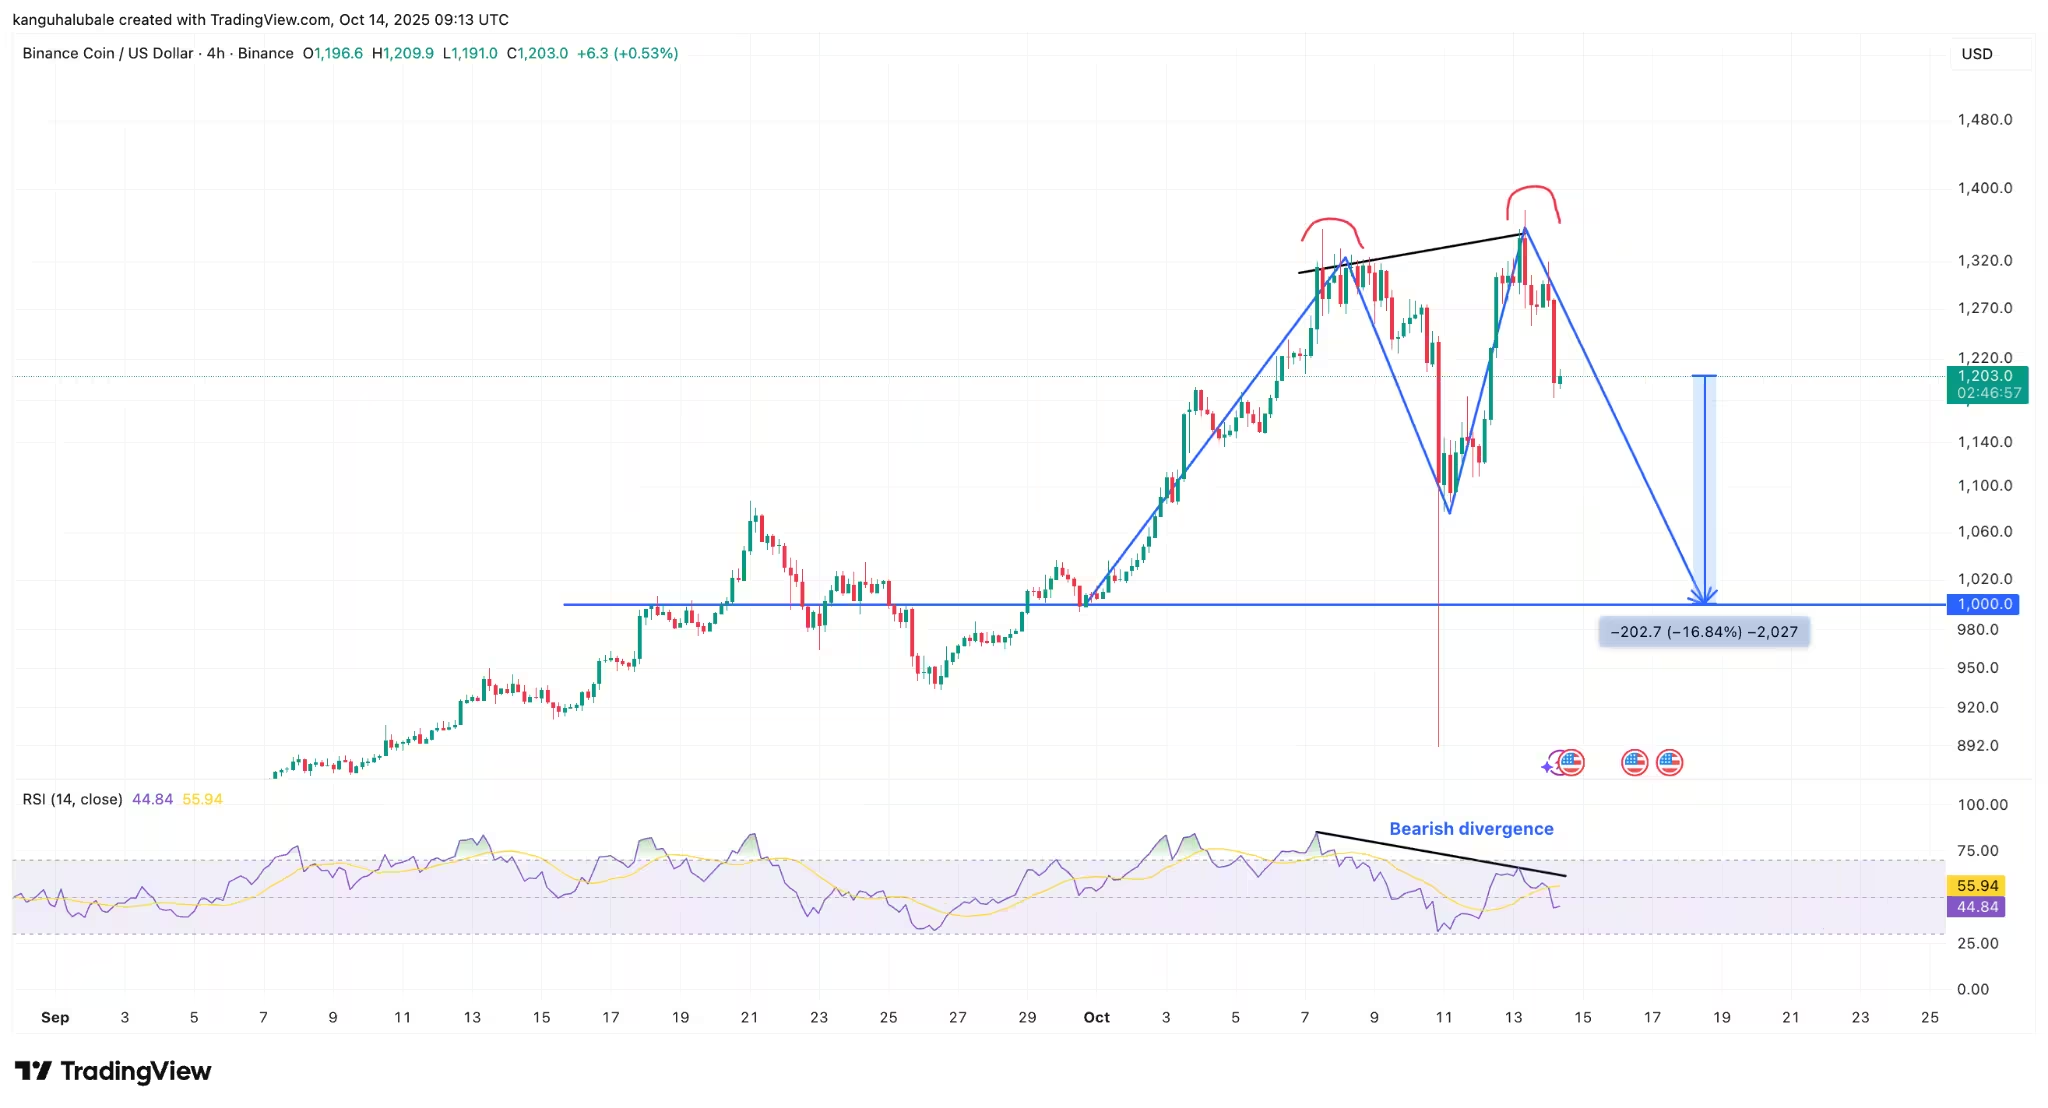
BNB/USD four-hour chart
Support zones and moving averages to watch
Critical technical support lies in the $730–$860 zone, where the 20-week and 50-week simple moving averages (SMAs) reside. These trendlines have historically acted as reliable floors during corrections. A decisive break below these SMAs could open the door to further downside, whereas a bounce there would support the case for renewed upside.
How deep could the correction go?
Near-term downside targets being discussed by analysts range from $800 to $1,000. The $1,000 psychological level also lines up with the neckline of the short-term double-top pattern on intraday charts. A drop to those levels would represent a healthy correction relative to the scale of the recent rally, and it could be absorbed if on-chain activity and network fundamentals remain strong.
Macro view: bulls still have the edge
Despite signs of short-term weakness, the monthly chart still shows a bullish macro structure. A long-running bull flag that has been developing since October 2023 remains intact, suggesting that, in the event of consolidation rather than capitulation, BNB could resume its ascent. Some technical scenarios project targets above $2,000 — even up to roughly $2,100 — if the flag resolves to the upside.

BNB/USD monthly chart
Fundamental drivers that could support a recovery
Off-chain factors may help sustain a renewed bull run. Recent positive developments include major remediation payouts by Binance and persistent network activity, both of which can reinforce user trust and on-chain demand. Higher transaction volumes, fee revenue and active addresses typically correlate with sustained appreciation for exchange-linked tokens like BNB.
Trading outlook and risk management
For traders focused on short-term entries, watching the RSI, key moving averages, and the $1,000 neckline is essential. A confirmed daily close back above the $1,350–$1,400 zone would favor bulls and could enable a run toward $1,600 and beyond. Conversely, a decisive breach of the $730–$860 support band would warrant a reassessment of the bullish thesis.
Risk management remains critical: set stop-loss levels, consider position sizing to account for volatility, and monitor macro liquidity conditions in crypto and broader financial markets.
Conclusion
BNB’s correction after a fresh all-time high is consistent with historical patterns where strong rallies are followed by sharper short-term pullbacks. While technicals point to possible declines toward $800–$1,000 in the near term, the monthly bull flag and robust network metrics leave room for a sustained uptrend. Traders should weigh short-term bearish signals against the broader bullish structure and manage exposure accordingly.
Source: cointelegraph
Leave a Comment