
4 Minutes
XRP at a Crossroads Near $2.50
XRP is trading around $2.49–$2.50 after sliding more than 31% from its July peak near $3.66. The recent pullback — including a 12.5% drop over the past week — has pushed attention onto key technical levels that will determine whether the token resumes an uptrend or extends losses.
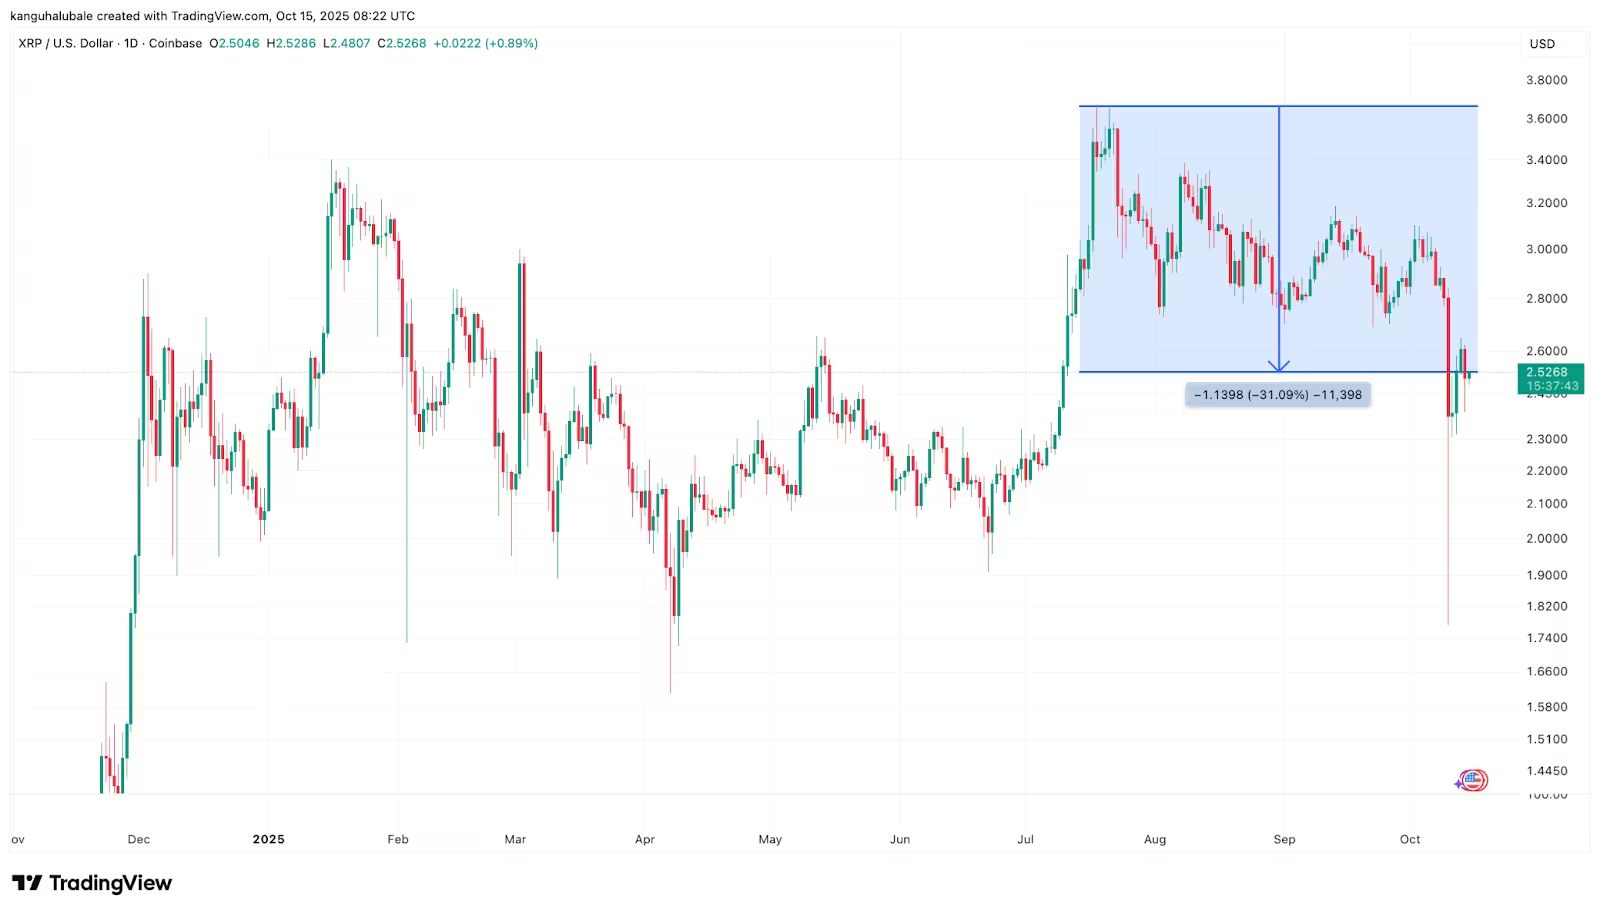
XRP/USD daily price chart
Key technical levels: 200-day SMA and the $2.70–$2.80 zone
For bulls to regain control, XRP must first close above the 200-day simple moving average (SMA), currently near $2.58 on the daily chart. Clearing that line would be a critical step toward flipping the nearby $2.70–$2.80 resistance range into reliable support and unlocking a move above $3.00.
Above those targets, traders are watching the $2.86–$2.96 band, where the 50-day and 200-day SMAs converge. A sustained break higher through those averages would signal renewed momentum for a crypto rally and could attract fresh buying from institutional and retail participants.
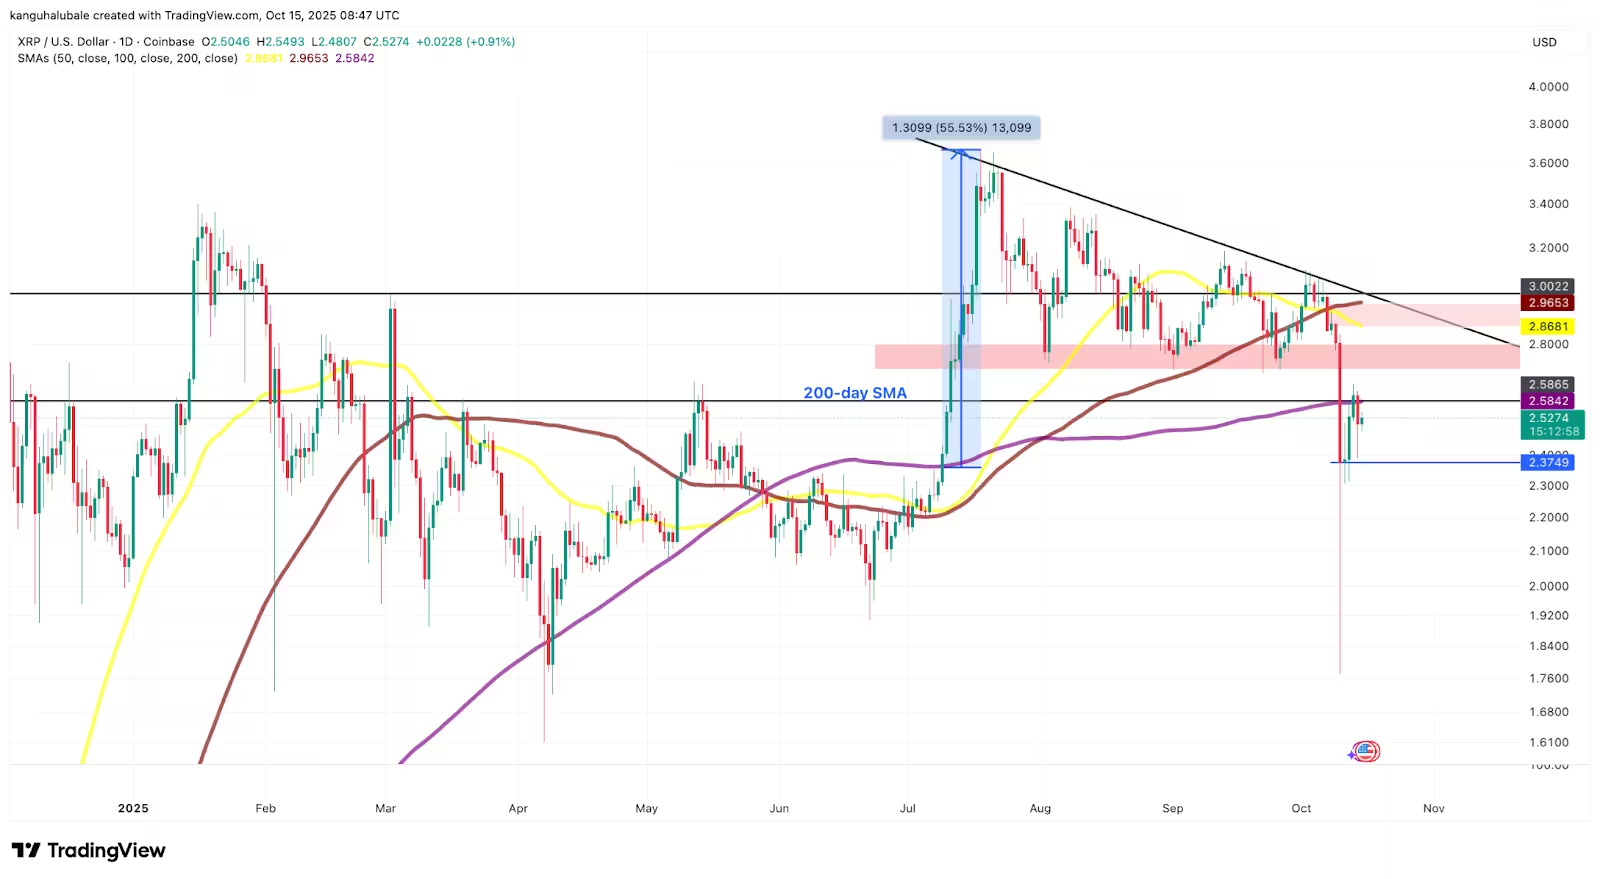
XRP/USD daily chart
Analyst probabilities: 57% upside vs. 43% downside
Technical analyst Egrag Crypto identifies XRP trading inside a descending broadening wedge, a pattern that historically resolves higher more often than not. Egrag assigns a 57% probability to an upside breakout from that formation. If the pattern resolves bullishly, measured targets range from roughly $9.50 up to $27, with a conservative floor near $9 and an average-cycle target of about $20.
Conversely, the wedge carries a 43% likelihood of breaking down, potentially dropping XRP as low as $0.50. That downside scenario, the analyst notes, could create a compelling buy-back opportunity for traders with longer time horizons.
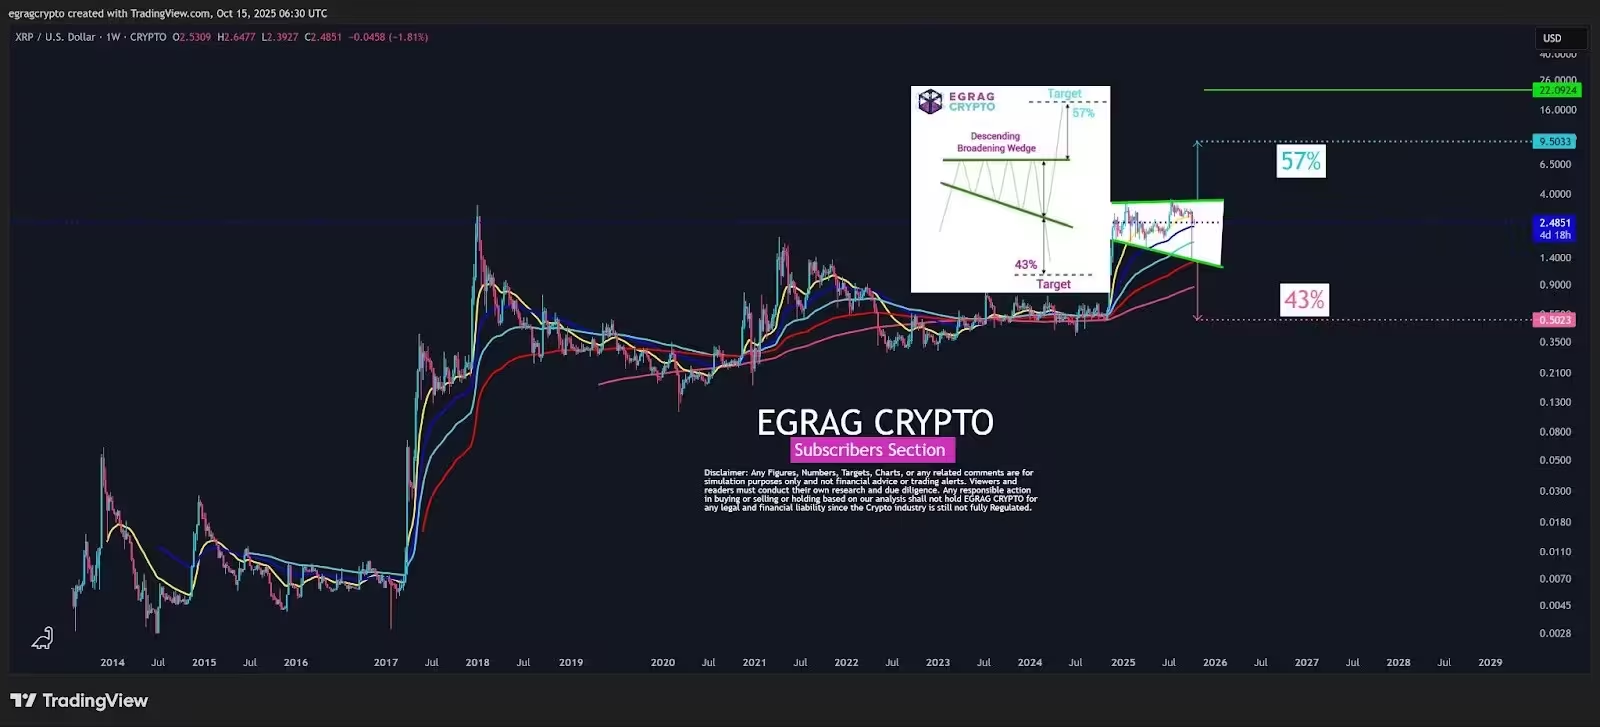
XRP/USD weekly chart
Short-term momentum indicators
Near-term indicators also matter: a daily close above the 20-day exponential moving average (EMA) at about $2.72 would support a bullish case, signaling that short-term momentum is returning. Several higher-timeframe oscillators — including an oversold weekly Stochastic RSI — point to the potential for a bullish reversal, reinforcing the argument that current levels may be a buying opportunity for momentum traders.
Macro view and wave counts
Elliott wave analyst XForceGlobal remains bullish on the macro outlook, describing the current range as a “confirmation stage” ahead of a final bullish push into wave 3. From a timing perspective, the chartist says conditions look favorable for a continuation of the larger bull cycle once those confirmation levels are cleared.
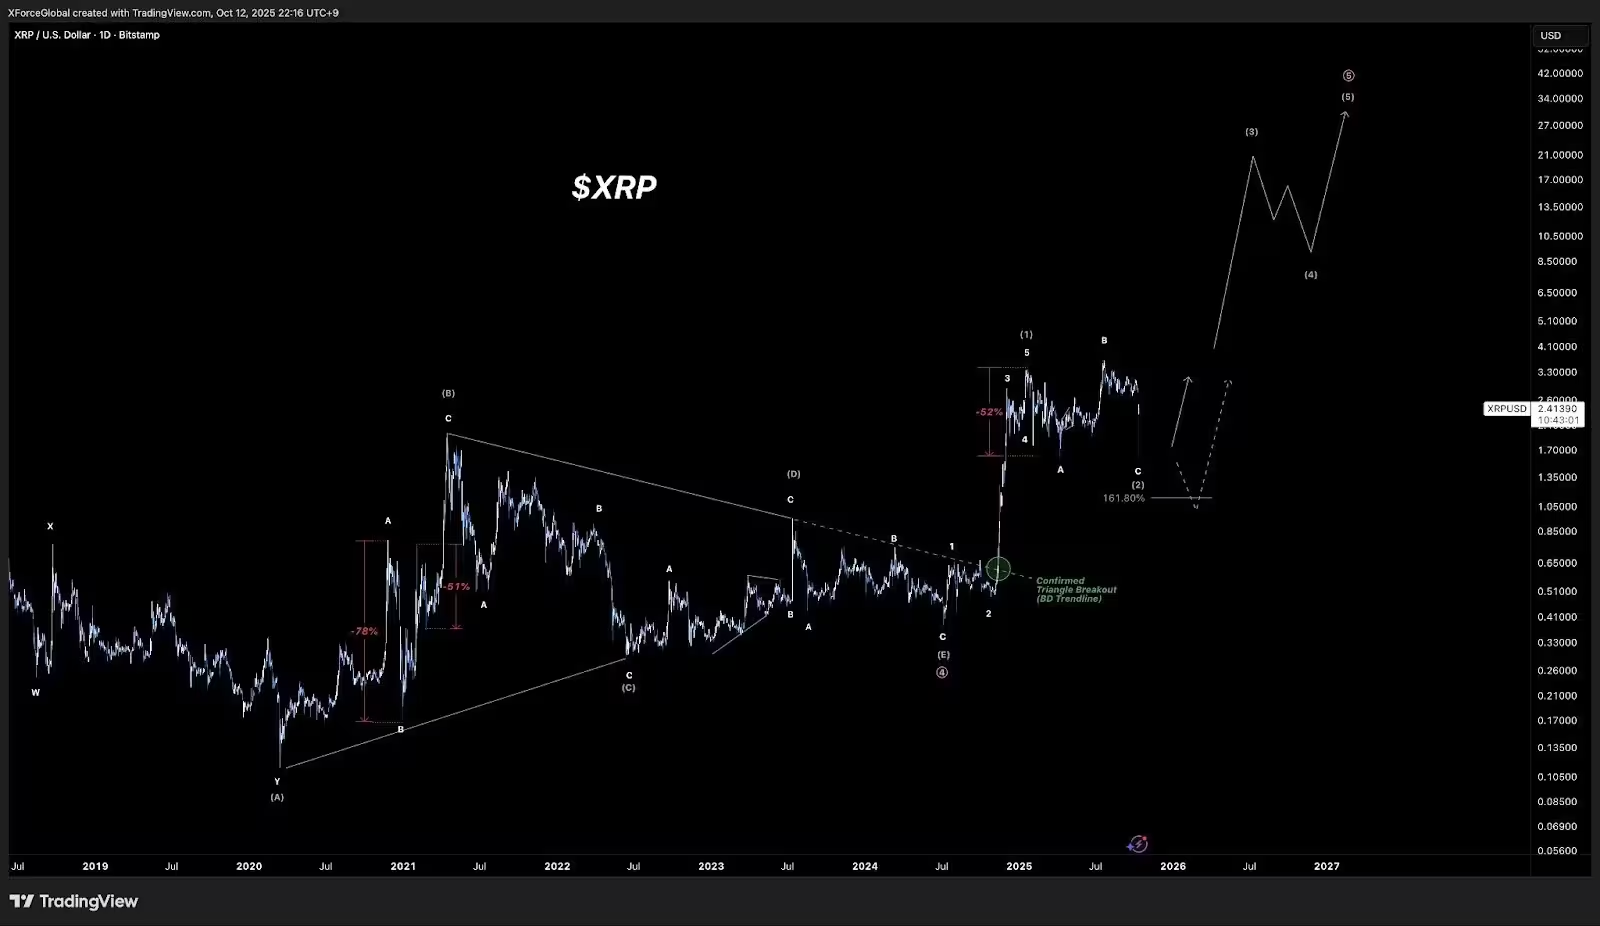
XRP/USD daily chart
What traders should watch next
- A daily close above the 200-day SMA ($2.58) and the 20-day EMA ($2.72) would boost the odds of a sustainable rally.
- Failure to hold $2.50 risks a deeper correction toward lower support levels, including the analyst-projected $0.50 scenario.
- Monitor volume and momentum indicators for confirmation of any breakout; divergence or low volume could signal a false move.
Overall, XRP’s technical setup offers a defined risk/reward profile: reclaiming key moving averages could trigger a sizable upside swing, while a breakdown below $2.50 would validate the more bearish projection. Traders and investors should weigh market liquidity, macro crypto sentiment, and on-chain data when sizing positions.
XRP price remains a focal point in the altcoin market as Ripple’s ecosystem developments and broader crypto market dynamics continue to influence sentiment and volatility.
Source: cointelegraph
Leave a Comment