3 Minutes
Shiba Inu slump deepens as Shibarium activity collapses
The Shiba Inu shib 1.86% Shiba Inu token was trading at the psychological level of $0.00010, well below its year-to-date high of $0.00001765 and last November’s high of $0.0000334.
Shiba Inu (SHIB) has lost double-digit value from its peak this year, and fresh on-chain data from Shibarium suggests the token could face further downside. Key network metrics — total value locked (TVL), active accounts and transaction volume — have all weakened, eroding the utility case that underpinned earlier rallies.
Why Shibarium’s decline matters for SHIB
Shibarium was introduced as a layer-2 scaling solution for the Shiba ecosystem, with transaction fees paid in BONE that are then converted to SHIB and burned — a mechanism designed to reduce circulating supply and support tokenomics. But that model depends on sustained network usage.
Recent on-chain snapshots show TVL on Shibarium has fallen below $1 million, a sharp contraction after the ShibaSwap exploit. Active participation has dwindled: ShibariumStat recorded just 243 active accounts on Oct. 22, with only two new accounts created that day and transactions down to roughly 2,300. On Oct. 22 the network generated 115 in fees — about $11 — effectively indicating negligible revenue and almost no burn activity from on-chain fees.
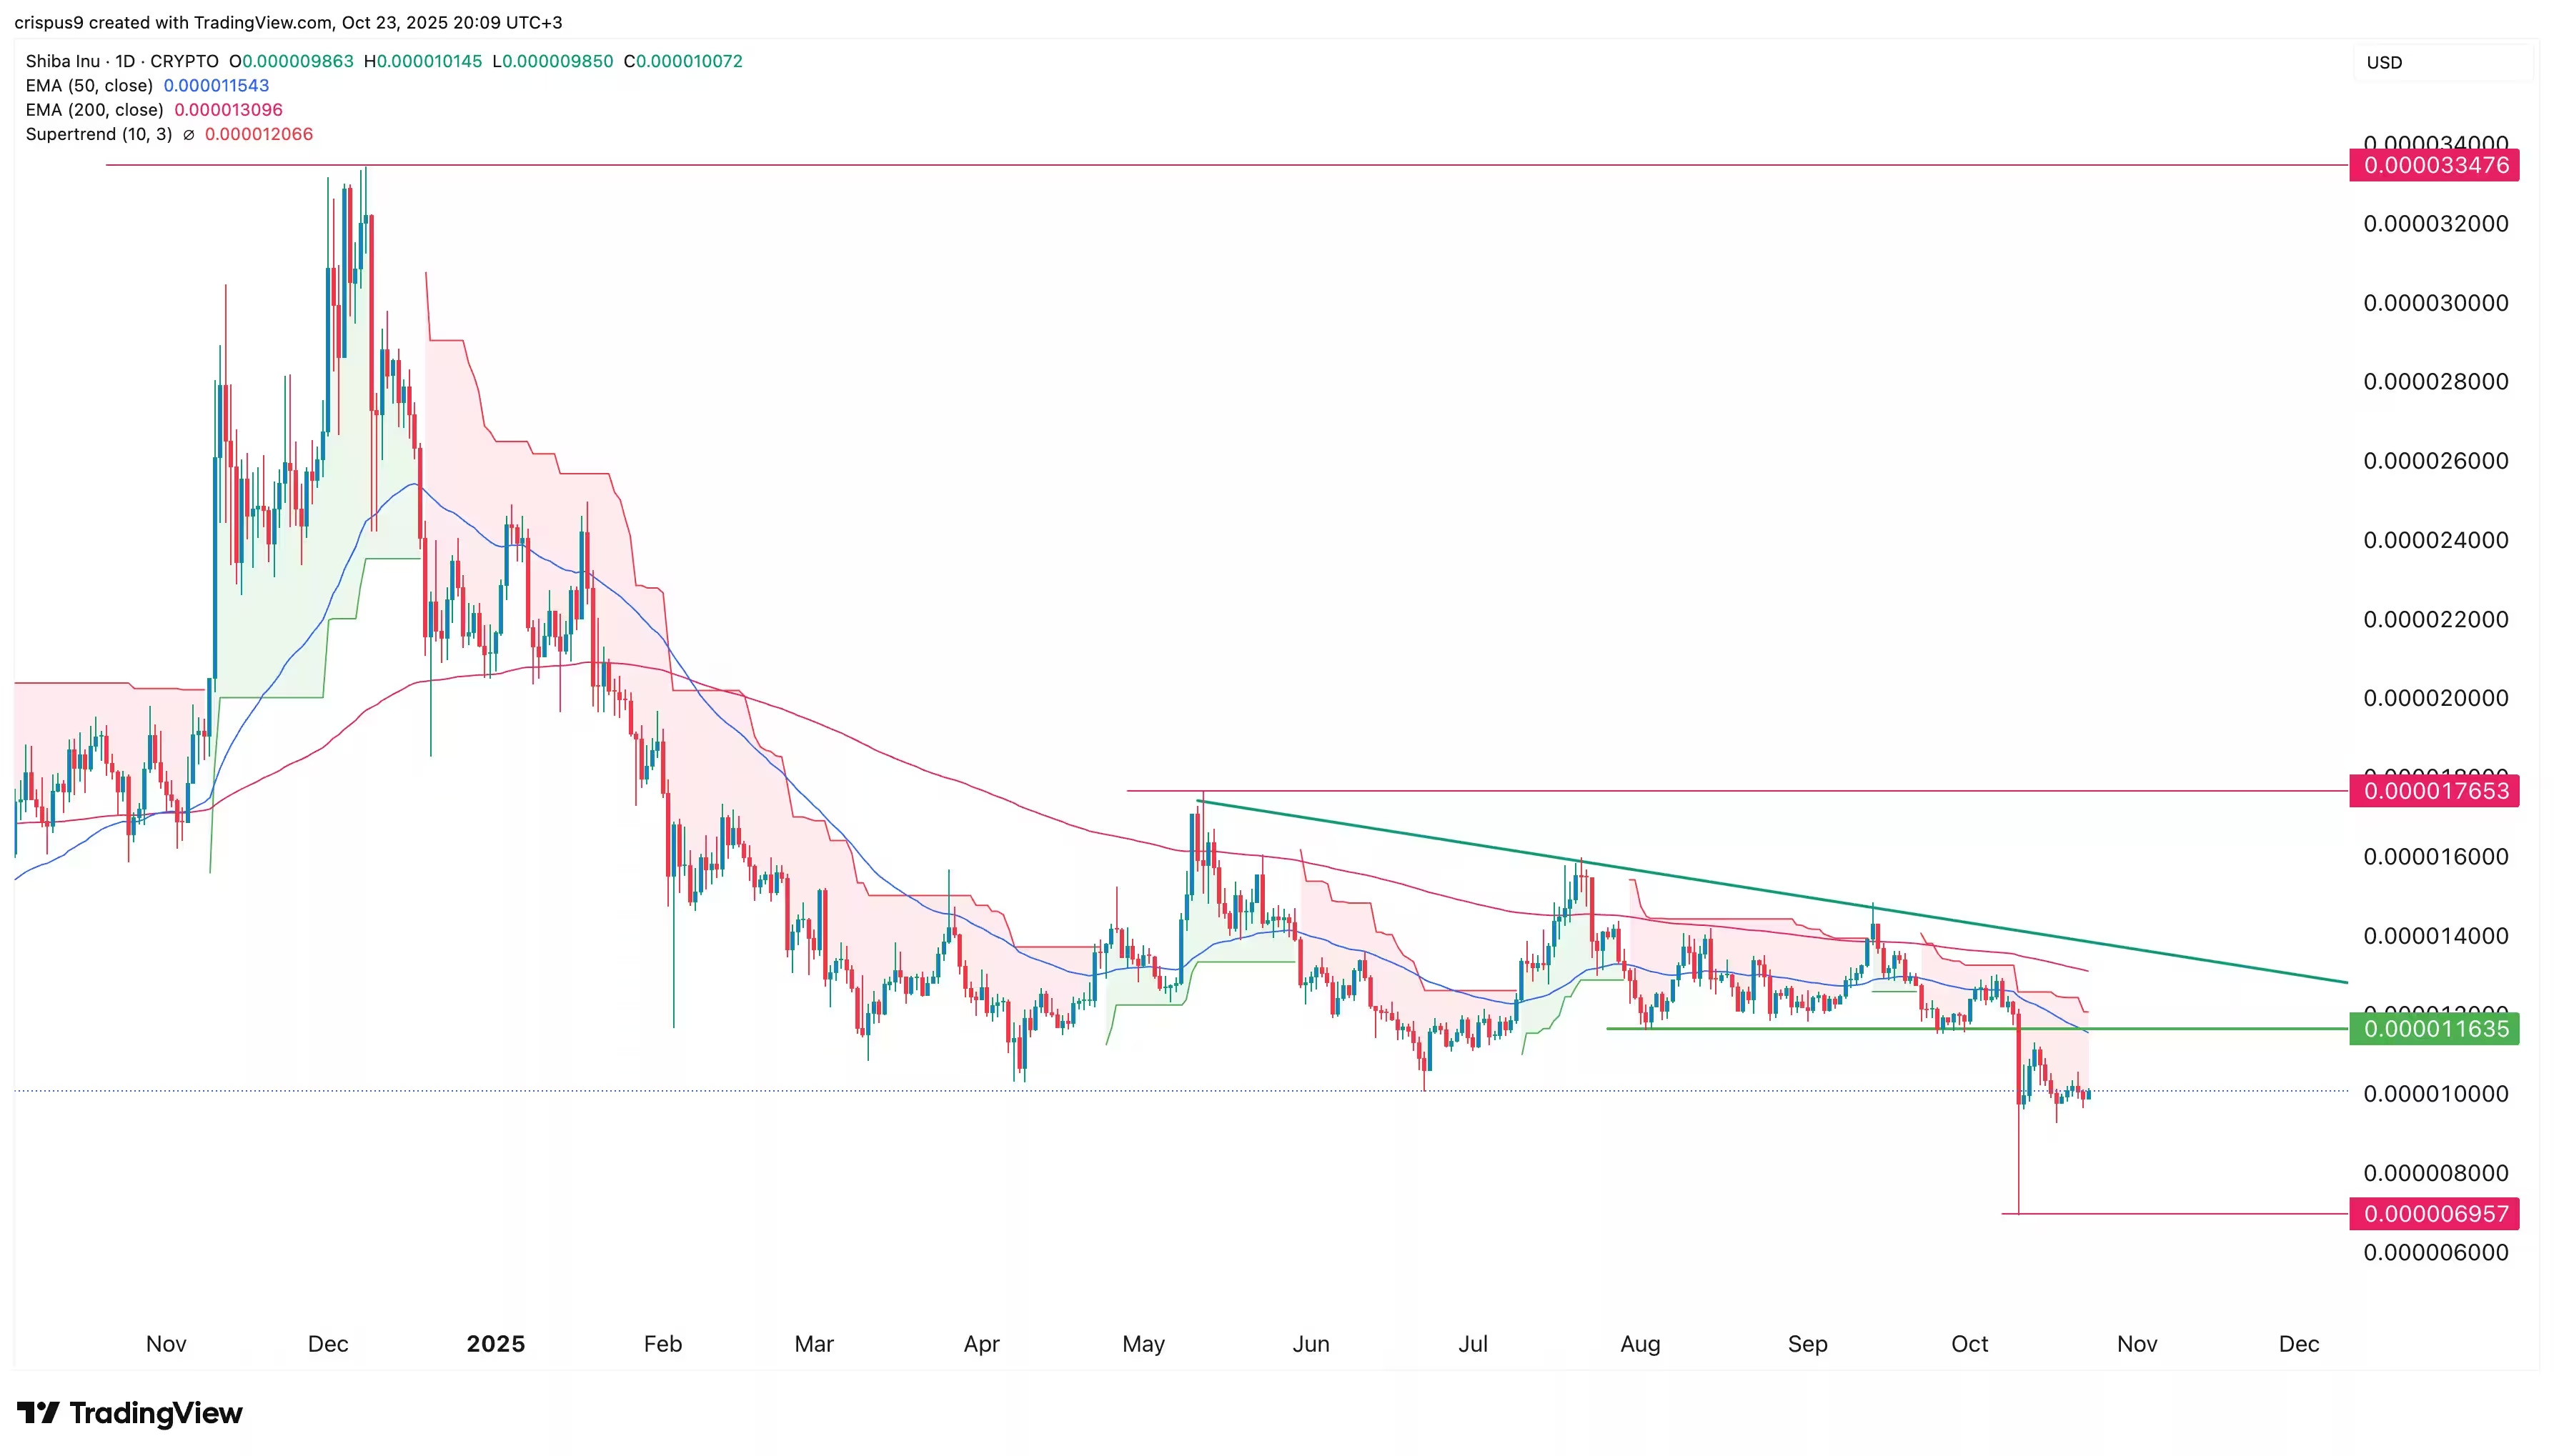
SHIB price chart
Meme coin contagion and broader market context
The SHIB decline mirrors losses across other meme tokens such as PEPE and certain Solana meme coins. For example, the aggregate market cap of Solana meme assets dropped from around $22 billion in January to roughly $7 billion today. These sector-wide outflows have weighed on investor sentiment and liquidity for lower-cap altcoins, amplifying SHIB’s pain.
Technical picture: key levels to watch
On the price charts, SHIB has slipped below important moving averages and momentum indicators. The token sits under the 50-day and 200-day exponential moving averages and has moved below the Supertrend signal, while the Relative Strength Index (RSI) continues to trend lower — all classic bearish confirmations.
Immediate resistance is seen at $0.00001163, a level that if reclaimed would invalidate the most bearish scenarios. Absent a recovery above that threshold, downside targets could include the year-to-date low around $0.000006957. Some technical models warn of even deeper pressure toward $0.00000069 if selling accelerates and liquidity thins.
What this means for traders and long-term holders
For traders, shrinking on-chain activity and diminishing TVL increase volatility and slippage risk, making short-term positions more hazardous. Long-term supporters should monitor Shibarium usage metrics (TVL, active accounts, transaction fees) and on-chain burn rates from BONE conversions — sustained improvement in those figures would be needed to rebuild SHIB’s utility narrative.
In summary, a combination of falling Shibarium engagement, sector-wide meme token weakness and bearish technical signals leaves Shiba Inu vulnerable to further declines unless network usage and tokenomics trends reverse.
Source: crypto
Leave a Comment