
4 Minutes
Bitcoin market snapshot: Uptober ends with a setback
Bitcoin (BTC) traded around $110,000 as month-end pressure erased much of the optimism built during "Uptober." The cryptocurrency finished October down nearly 4%—its worst October performance since 2018—driven in part by renewed sell-side flows from spot Bitcoin ETFs and cautious positioning from derivatives desks.
BTC price chart
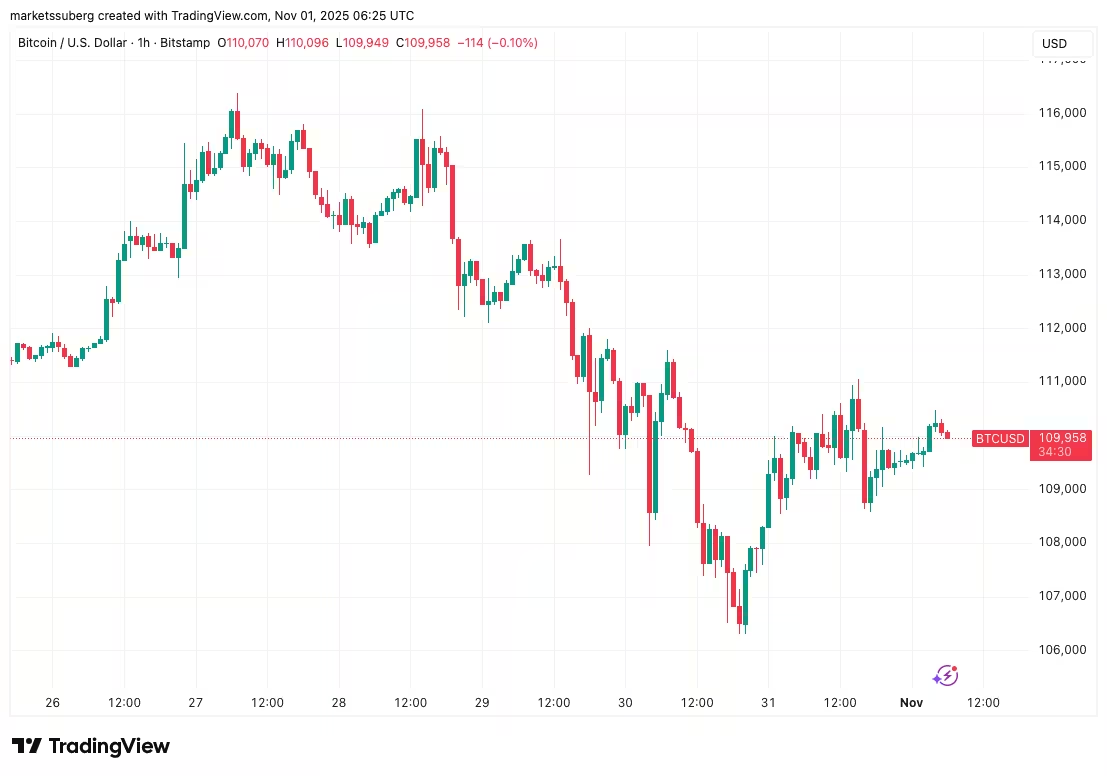
BTC/USD one-hour chart
ETF outflows and on-chain signals point to weakening institutional demand
On-chain analytics and fund-flow trackers showed clear signs that capital was leaving the market. Data from Farside Investors recorded significant net outflows from US spot Bitcoin ETFs late in the week—continuing a trend that intensified selling pressure across both U.S. exchanges and ETF vehicles.
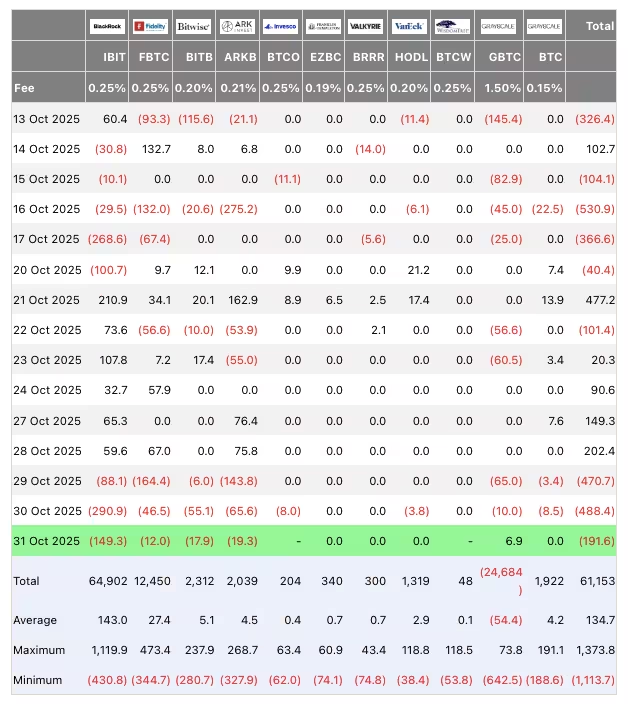
US spot Bitcoin ETF netflows
Glassnode and other on-chain monitors highlighted the same theme: ETF outflows are signaling rising sell pressure from traditional finance participants and a cooling of institutional demand. That dynamic was notable because it offset an otherwise supportive macro backdrop, including expectations around U.S. interest-rate moves.
Macro backdrop: Fed cut but caution persists
While the Federal Reserve delivered an anticipated rate cut, messaging around future policy kept market players guarded. The lighter-than-hoped optimism from macro catalysts translated into option-market prudence and more hedging by institutional desks, muting any sustained BTC rally after the Fed update.
Trader perspectives: consolidation and key levels to watch
Traders describe the current price action as a consolidation phase that could morph into a deeper capitulation if support fails. Some analysts characterize the move as a time-based capitulation around the $100,000 zone, warning that a weekly close beneath this level would confirm a downtrend.
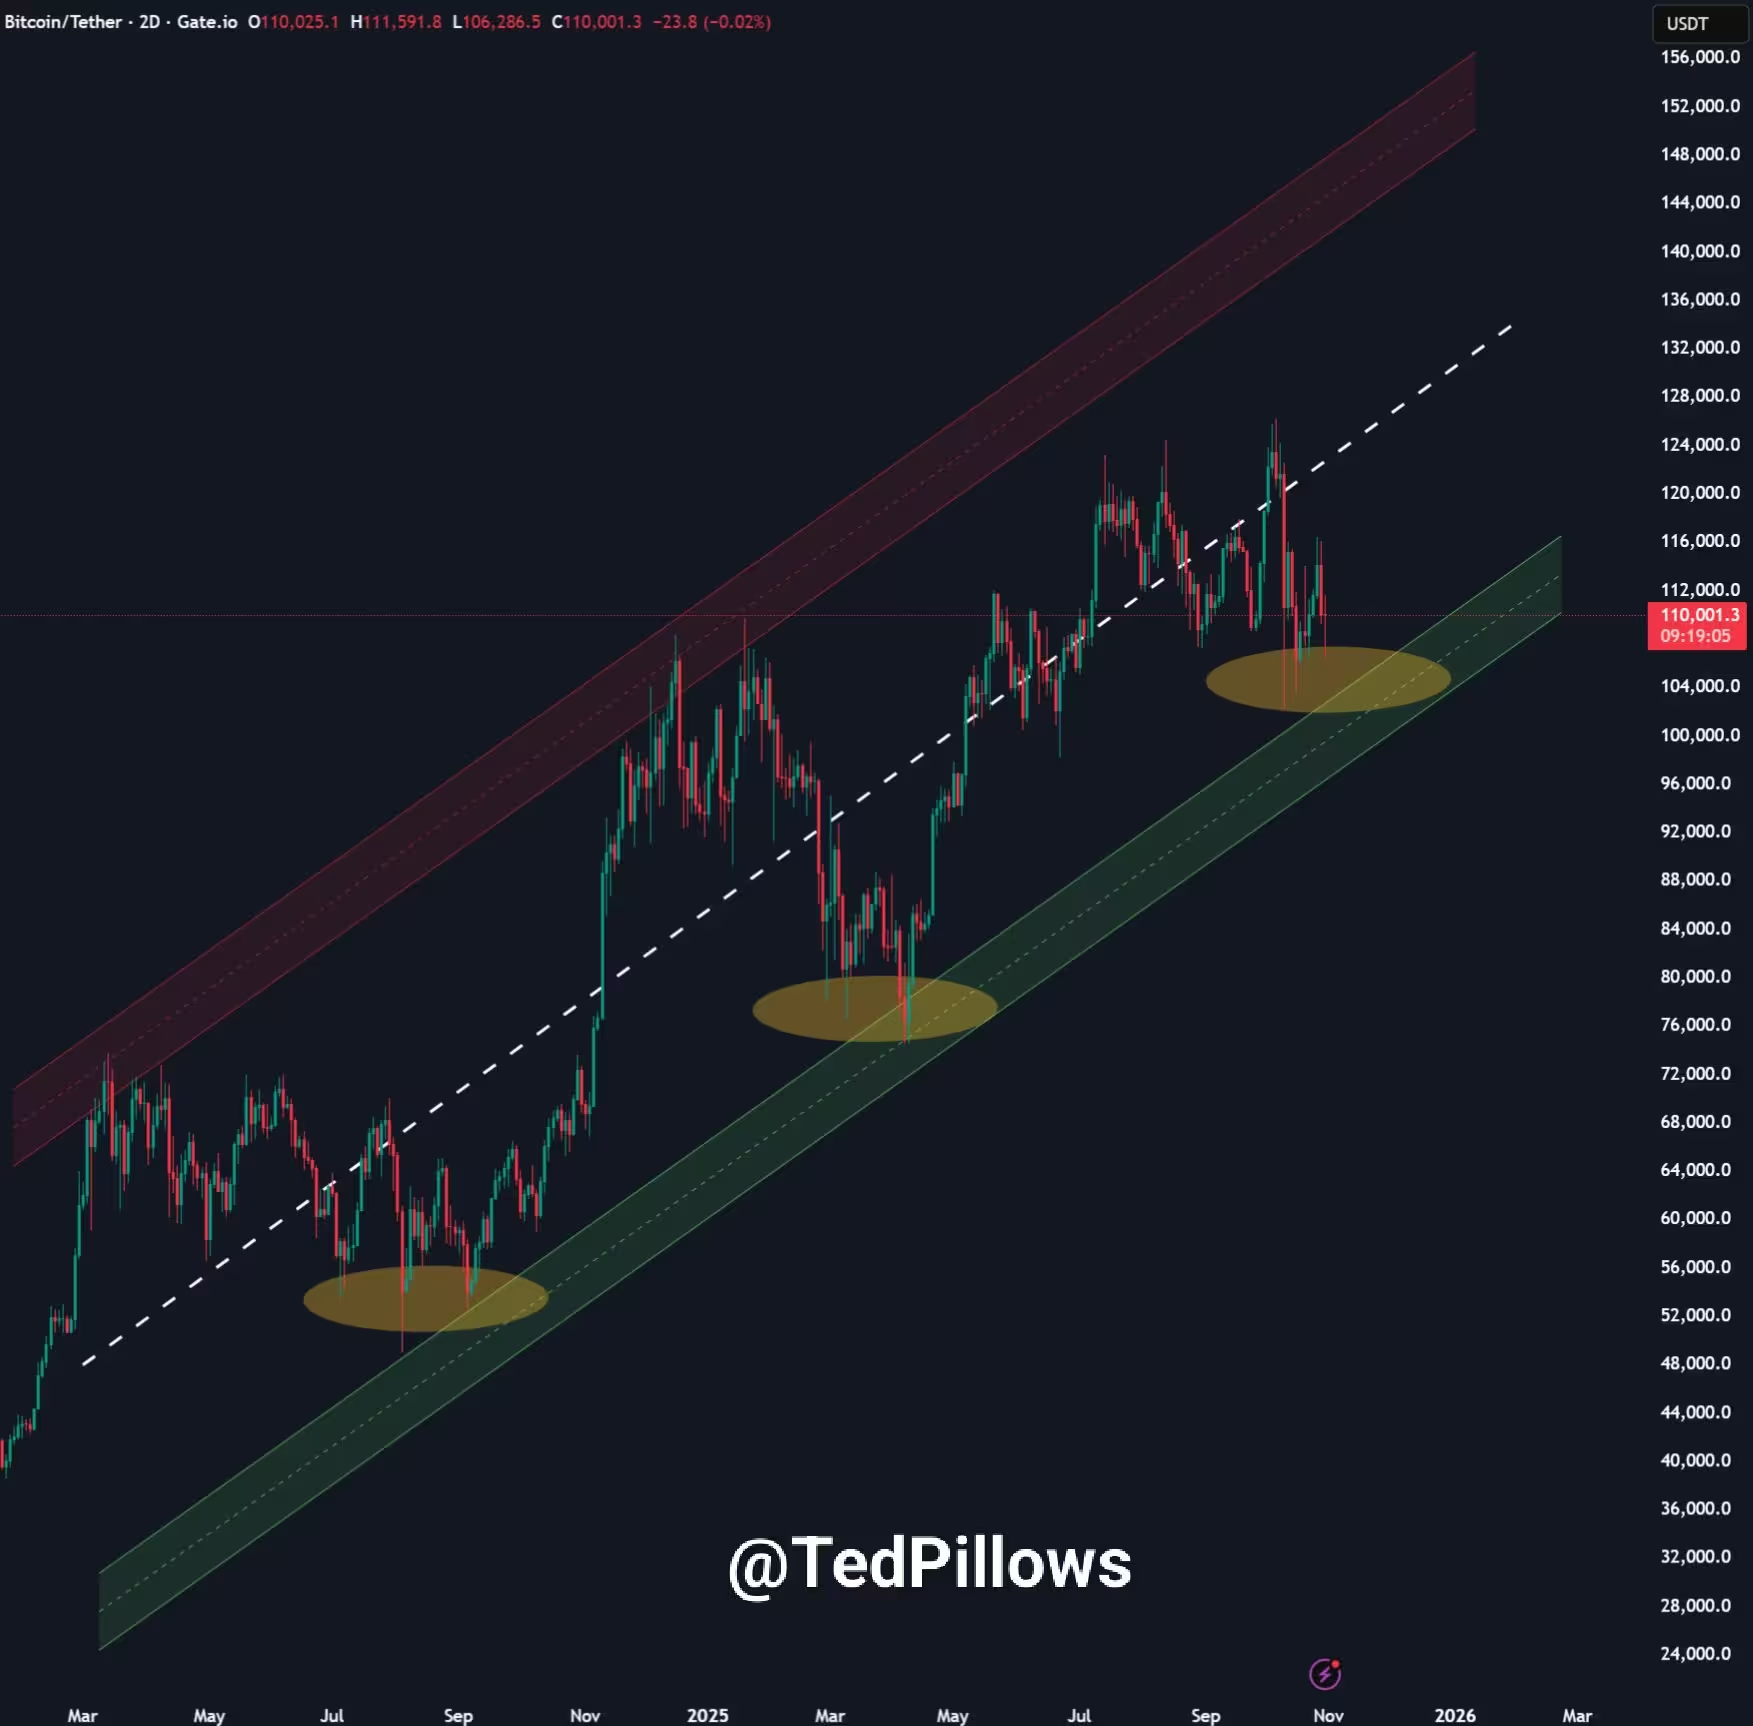
BTC/USDT two-day chart
Other traders are watching a local range for decisive breakout levels. Market voices have identified $107,000 and $116,000 as the critical boundaries: a clean break below $107K would likely add bearish momentum, while a rise above $116K could revive buyers and open a sustainable rally.
Bollinger Bands signal a volatility return
Technical indicators point to a likely increase in price swings. The Bollinger Bands on monthly timeframes have compressed to historically extreme levels, a setup that typically precedes expanded volatility. Analysts interpret the narrowing as a preload for a substantial move—either higher or lower—once volatility returns.
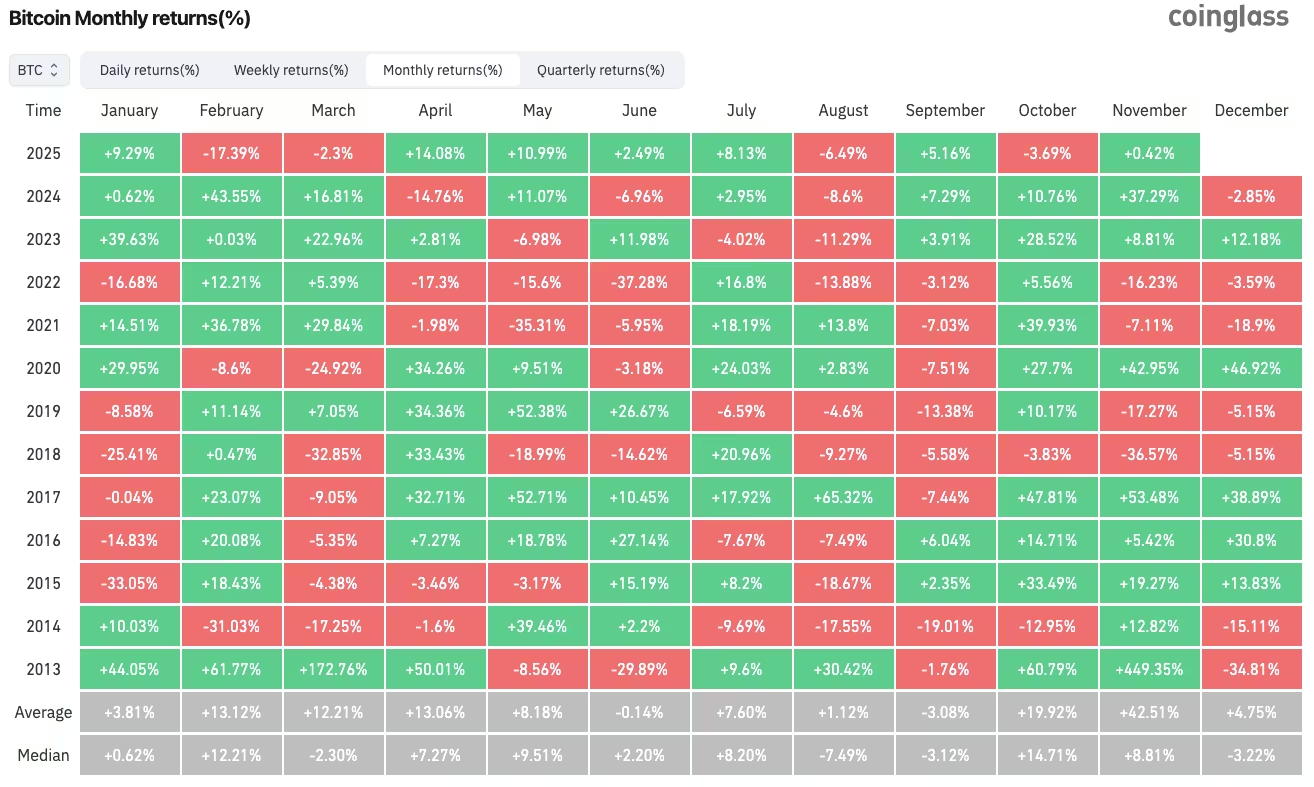
BTC/USD monthly returns
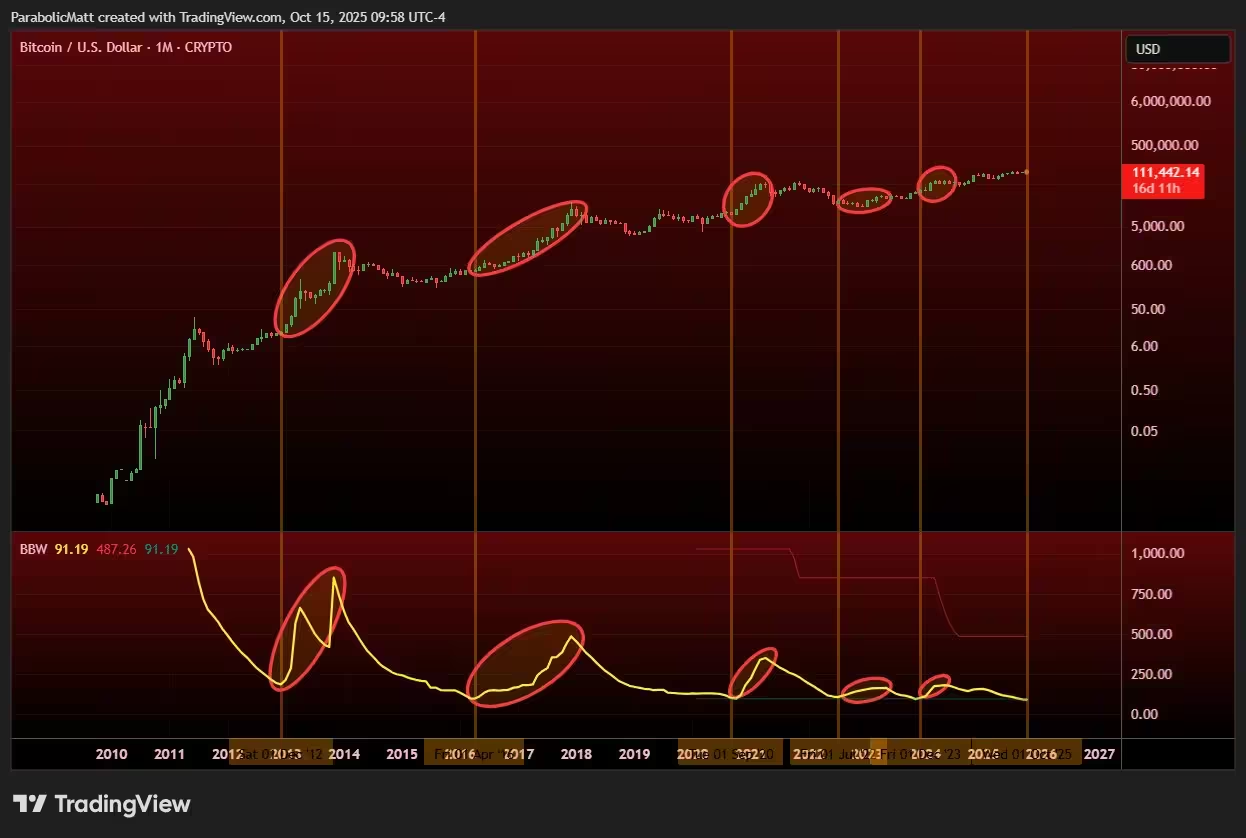
BTC/USD one-month chart with Bollinger Bands data
Why this matters for traders and investors
Compressed Bollinger Bands after extended consolidation often produce sharp directional moves. For traders, that means preparing for heightened BTC price volatility and managing position sizing accordingly. For institutional and retail investors, ETF flows and on-chain demand trends remain essential indicators for gauging near-term supply pressure and liquidity.
Outlook: prepare for volatility but watch seasonality
Historically, November has been one of Bitcoin’s strongest months, with multi-year averages showing notable upside. If seasonal patterns hold and ETF demand stabilizes, BTC could stage a recovery. Conversely, if ETF outflows persist and a weekly close below the $100K area occurs, markets may face an extended correction.
Key themes to monitor in the coming weeks: spot Bitcoin ETF flows, institutional on-chain demand, the Bollinger Bands volatility signal, and decisive price action around $107K and $116K. Traders should maintain disciplined risk management as volatility is poised to return.
Source: cointelegraph
Leave a Comment