
3 Minutes
Solana gains footing as SOL ETFs keep drawing capital
Solana (SOL) is showing early signs of recovery after a recent sell-off that pushed the token down to roughly $150. Data compiled by crypto.news indicates a modest daily uptick of about 1.18%, suggesting that short-term momentum is tilting back toward buyers. The recovery attempt is being supported by continued inflows into funds tracking Solana, even as broader market uncertainty persists.
ETF inflows remain a key support
Exchange-traded funds that track Solana have become an important source of demand for SOL. Week-to-week flow data from SoSovalue showed notable activity, including an inflow peak of $70.05 million on November 3. That pace cooled sharply over the next two days, with inflows declining to $14.83 million on November 4 and $9.70 million on November 5. Recent contributions were led by Bitwise BSOL and Grayscale GSOL, which added about $7.46 million and $2.24 million respectively during the latest reporting window.
Macro uncertainty weighing on sentiment
Despite sustained ETF interest, Solana faces headwinds from macro events that are sapping market confidence. The US government shutdown—entering its 37th day at the time of this report—has heightened volatility across both traditional and crypto markets and narrowed liquidity. This uncertainty coincides with a drop in the Crypto Fear and Greed Index to 24, a signal that investors remain cautious and that risk appetite is muted.
Technical picture: short-term rebound, but bearish control remains
Technically, SOL is attempting to regain ground but continues to trade below its 9-day simple moving average (SMA) near $175.85, which favors the bears in the short term. The relative strength index (RSI) sits around 33.58, placing SOL in oversold territory that could set the stage for a bounce if buying interest persists.
Support and resistance to watch
Immediate support for Solana is tracking near $159, a level that has held during recent intraday swings. If selling pressure increases, the next meaningful floor appears around $150, where buyers historically step in to defend the token. On the upside, reclaiming the $175 area and the 9-day SMA would be an important technical signal. Clearing that zone could shift sentiment to neutral or even bullish and open a path toward testing $180 as the next major resistance.
What traders should monitor
Market participants should watch ETF flow reports closely, since large inflows or sudden outflows can quickly change short-term price dynamics for SOL. Keep an eye on macro events such as the government shutdown and macro liquidity conditions that affect institutional demand. From a charting standpoint, watch the $159 and $150 support levels and the $175 to $180 resistance band. RSI and moving averages will help confirm whether this rebound is sustainable or just a relief bounce after heavy liquidations.
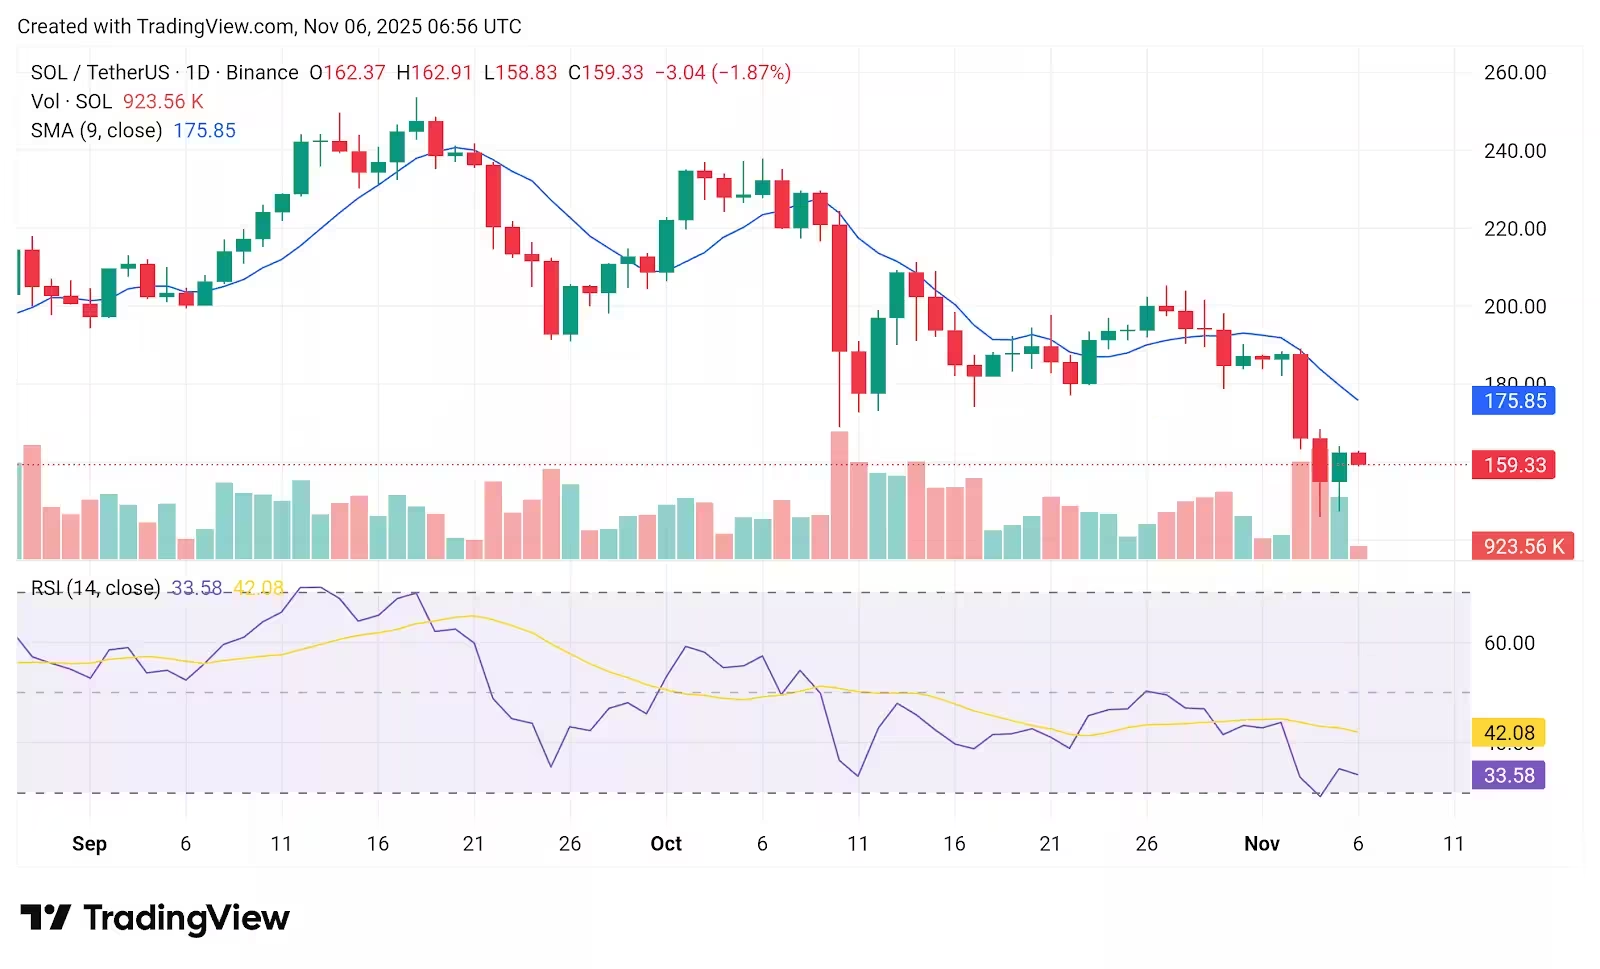
Solana price chart amid SOL ETF inflows
Bottom line: SOL is gathering modest upward momentum as SOL-tracking ETFs continue to inject liquidity. Still, the broader market's risk-off tone and technical indicators below key moving averages mean traders should exercise caution. A decisive move above $175 would be the clearest signal that a more durable recovery is underway.
Source: crypto
Leave a Comment