
4 Minutes
Why the $100K trendline is back in focus
Bitcoin (BTC) regained attention this week as U.S. spot Bitcoin ETFs posted fresh inflows and price action gravitated toward the key 50-week exponential moving average (EMA) at roughly $100,000. After a brief correction that pushed BTC below six figures, inflows totaling $240 million on Thursday ended a six-day outflow streak and prompted traders to reassess near-term momentum.
Key takeaways
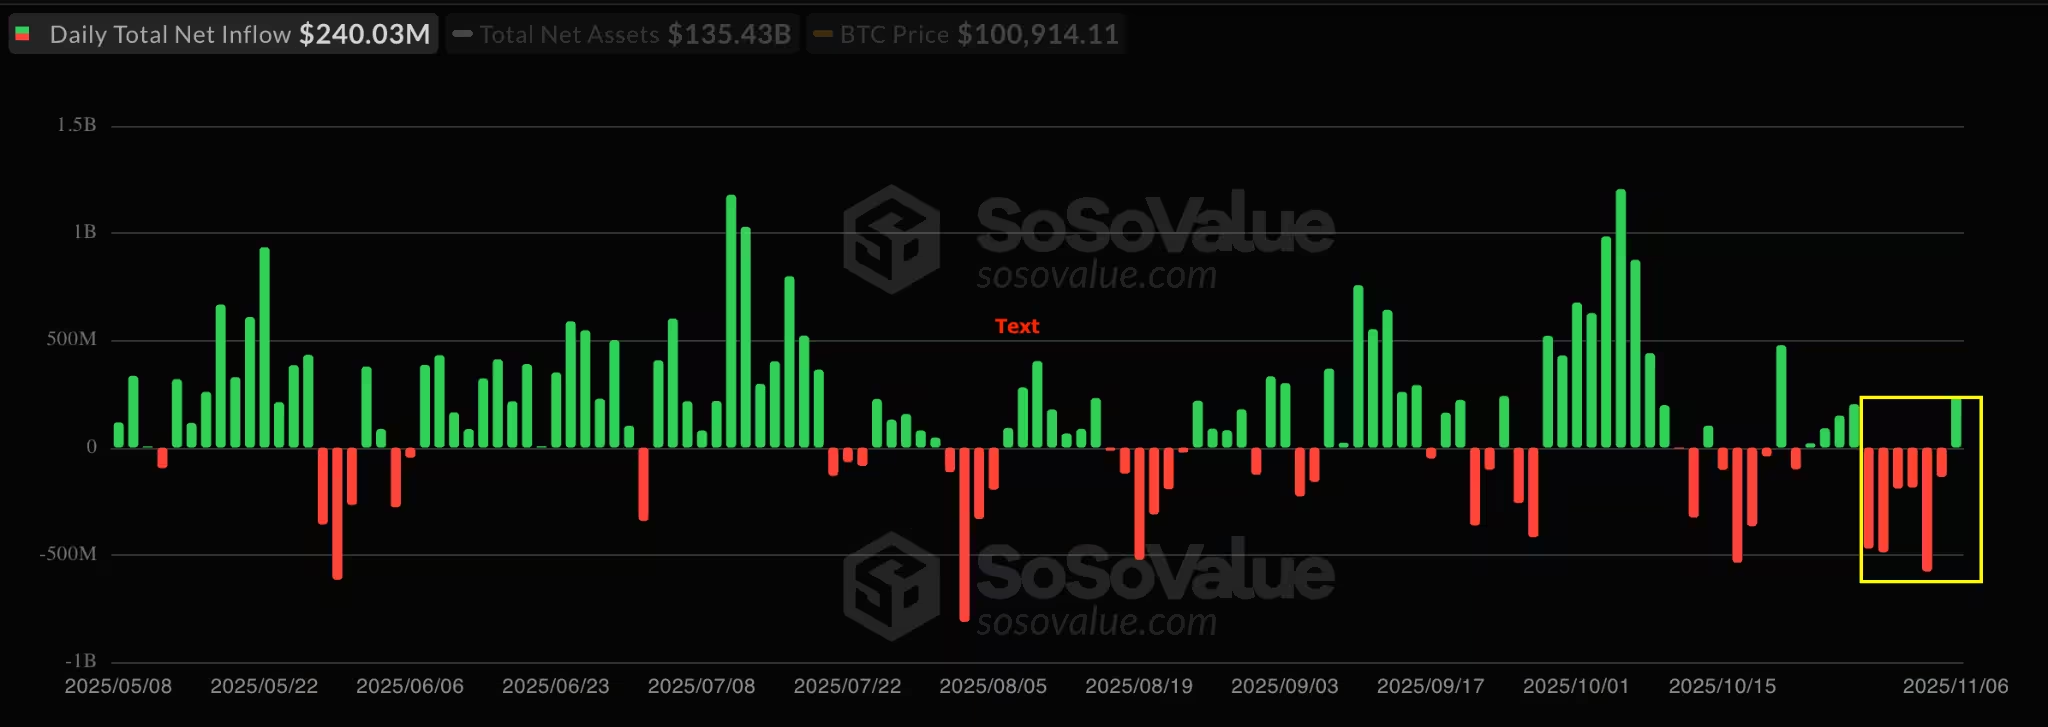
- Spot Bitcoin ETFs recorded $240 million in inflows on Thursday, halting consecutive outflows.
- The $100,000 zone aligns closely with the 50-week EMA, providing a psychological and technical support level.
Spot Bitcoin ETF inflows break the streak
U.S.-listed spot Bitcoin ETFs reversed a multi-day run of redemptions with roughly $240 million of net inflows on Thursday. The outflow streak had begun on Oct. 29 and included a peak single-day withdrawal of about $577.74 million earlier in the week. The inflow surge was concentrated in a few major ETFs, helping lift sentiment across the market after a short-term bottom was tagged.
Spot Bitcoin ETFs break six-day outflow streak
BlackRock’s IBIT led the inflows with $112.4 million, while Fidelity’s FBTC added $61.6 million. ARK Invest’s ARKB contributed about $60.4 million. Bitwise’s BITB posted more modest inflows of $5.5 million and $2.48 million in separate line items, and the broader ETF complex saw limited activity beyond the top funds. Cumulative net inflows for spot Bitcoin ETFs remain substantial at roughly $60.5 billion, with total assets under management across the suite at $135.43 billion — about 5.42% of Bitcoin’s market capitalization.
Technical view: 50-day and 50-week moving averages
Price action this week reinforced the importance of the 50-day and 50-week moving averages. Bitcoin briefly dipped to a four-month low near $98,900 before reclaiming the $100,000 psychological mark. That level overlaps the 50-day EMA and sits close to the widely watched 50-week EMA/SMA, which many traders label the "line in the sand."
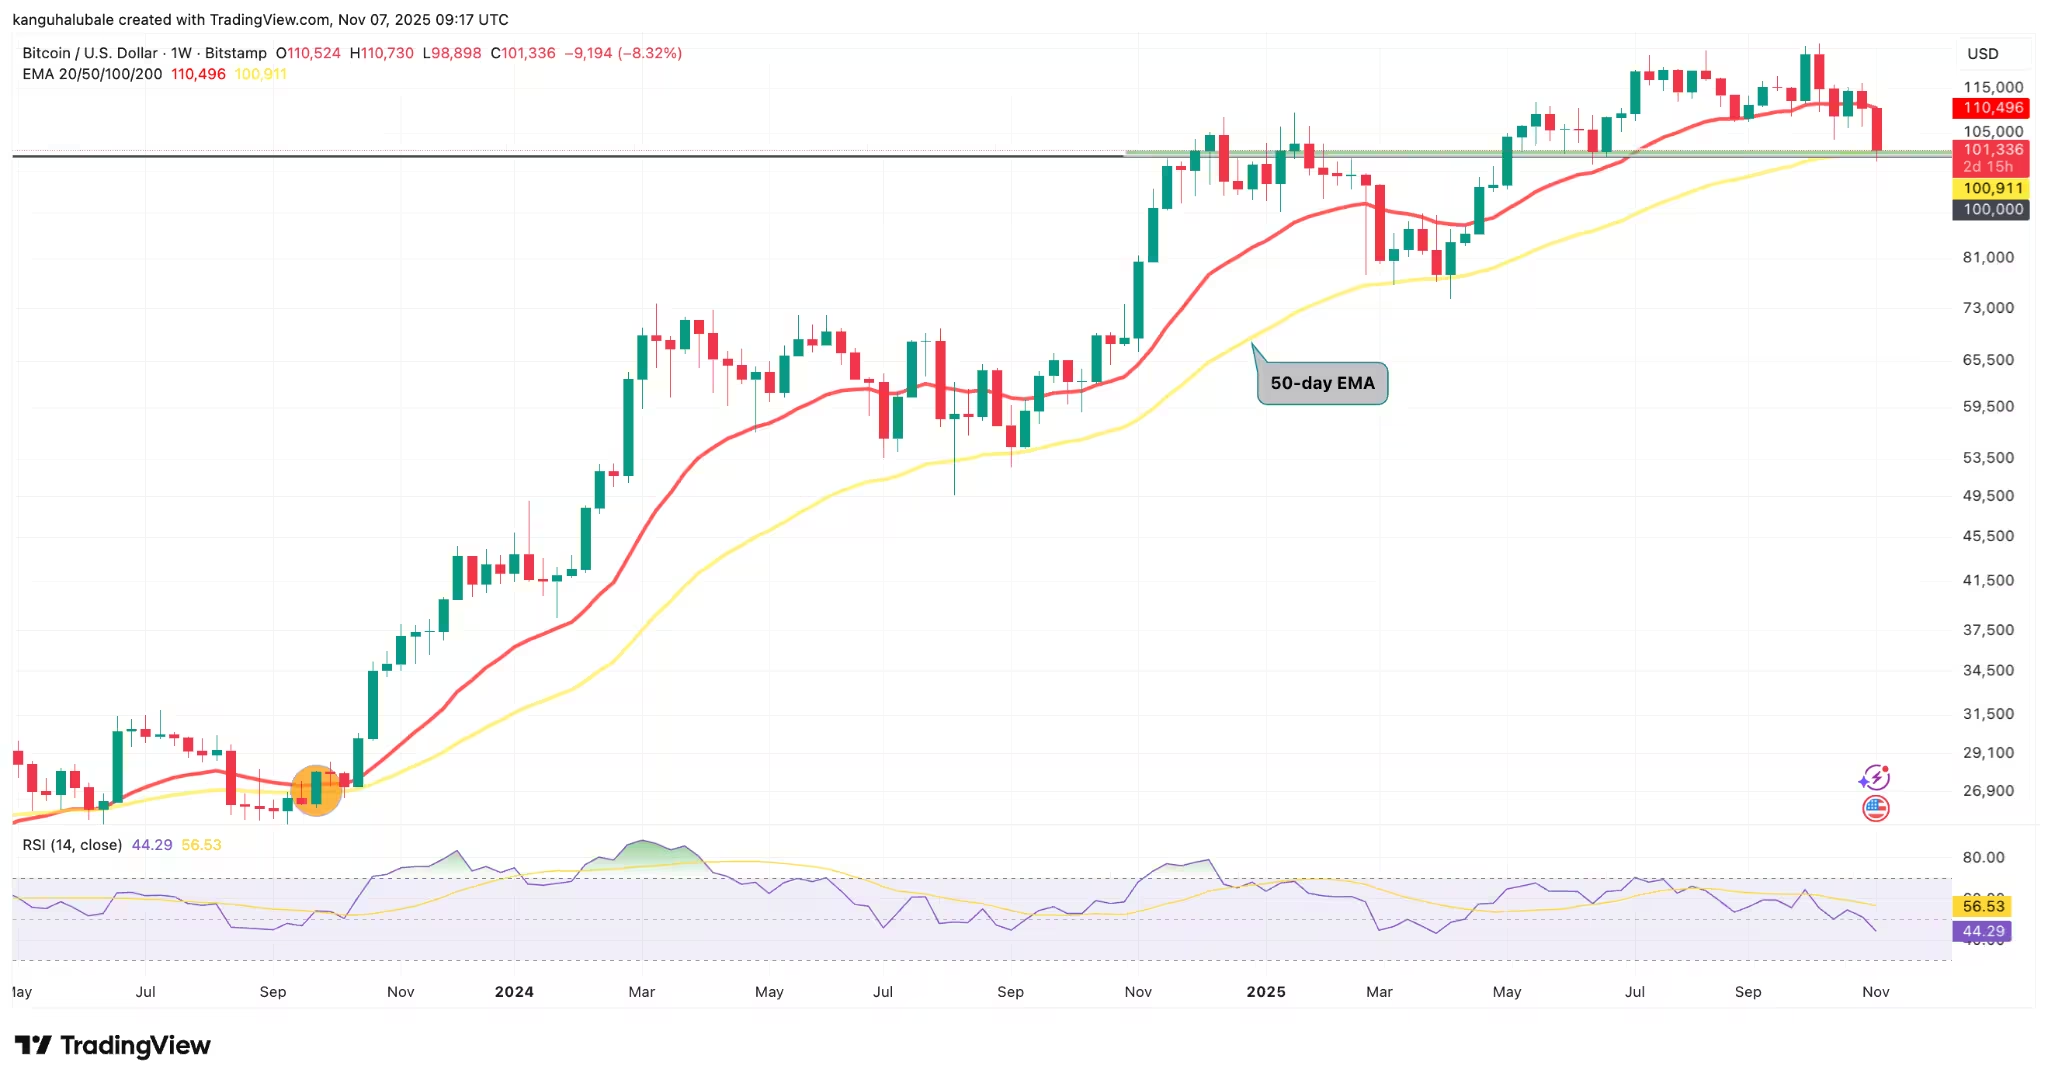
BTC/USD weekly chart
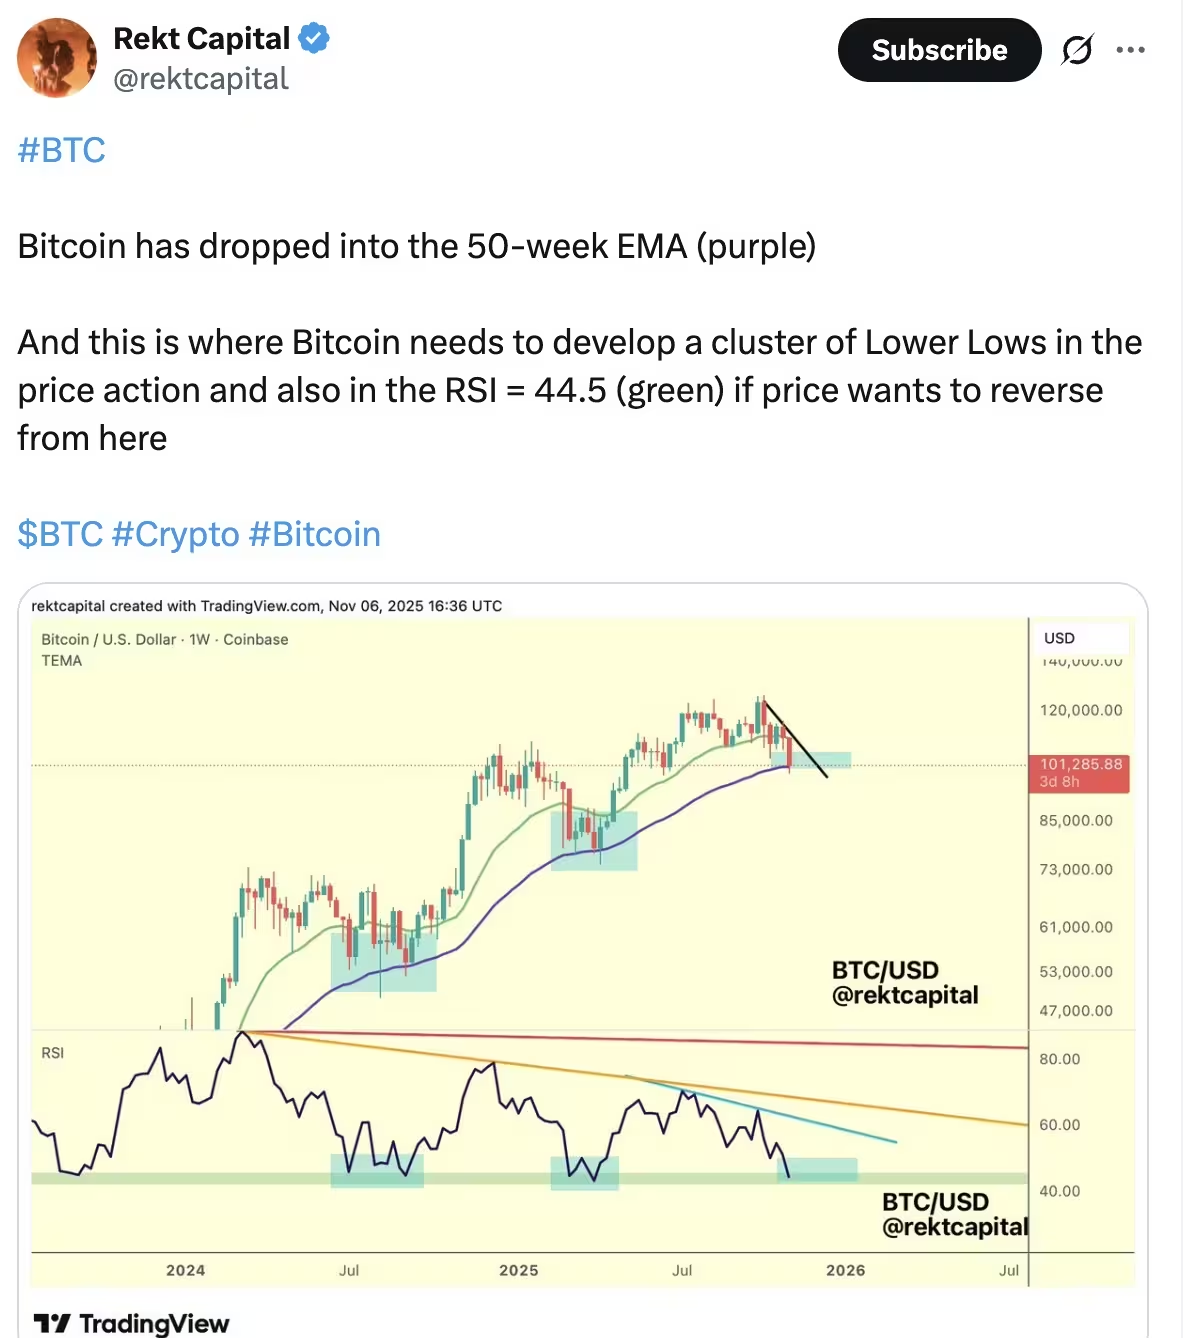
Prominent analysts and market commentators emphasized that weekly closes below the 50-week average could open the door to deeper selling pressure, while sustained holds above it are interpreted as a sign that long-term bulls remain in control. Technical commentator Rekt Capital and other chartists noted that forming a cluster of lower lows at the 50-day or 50-week averages would be necessary for a confirmed bottom; otherwise, the region serves as immediate support.
On-chain context: MVRV and local bottoms
On-chain metrics lent additional evidence that the recent dip may have carved out a local trough. The market value to realized value (MVRV) ratio, which helps gauge profit-taking and seller exhaustion, suggested that $98,000 could mark a short-term bottom — a view consistent with the observed rebound and renewed ETF buying.
What traders should watch
Market participants will monitor ETF flows, weekly closes around the 50-week EMA, and on-chain indicators like MVRV for confirmation of a sustained recovery. Institutional demand from firms such as BlackRock and Fidelity remains a key driver of liquidity into spot Bitcoin ETFs and could continue to influence price action near the $100K trendline.
Overall, the convergence of ETF inflows, technical support around the 50-week EMA, and on-chain signs of buyer exhaustion make the $100,000 neighborhood a critical battleground for bulls and bears in the near term.
Source: cointelegraph
Leave a Comment