3 Minutes
Overview: Zcash's sharp comeback and steep pullback
Zcash (ZEC) staged a dramatic rally in recent months, surging from sub-$50 territory to a yearly peak near $742 before collapsing roughly 50% to trade around $352 on Dec. 6. The token’s market capitalization fell from more than $11 billion to about $5.8 billion as the move reversed most of the recent gains.
Why technical analysts point to the Wyckoff Theory
Technical traders frame the spike-and-crash sequence not as random volatility but as a classic Wyckoff pattern. The Wyckoff Theory, a century-old market framework, describes how assets move through accumulation, markup, distribution, and markdown phases. For ZEC, the long period of sideways action signaled accumulation. That consolidation set the stage for the sharp markup that began in September.
Long consolidation then a swift markup
Weekly charts show ZEC trading in a tight range for more than three years, largely missing intermittent mini-rallies. This low-volatility period coincided with regulatory pressure on privacy-focused tokens and delistings by some exchanges, which kept ZEC muted until a catalyst arrived. Grayscale’s Zcash fund filing in September appears to have provided that catalyst, triggering the markup phase.
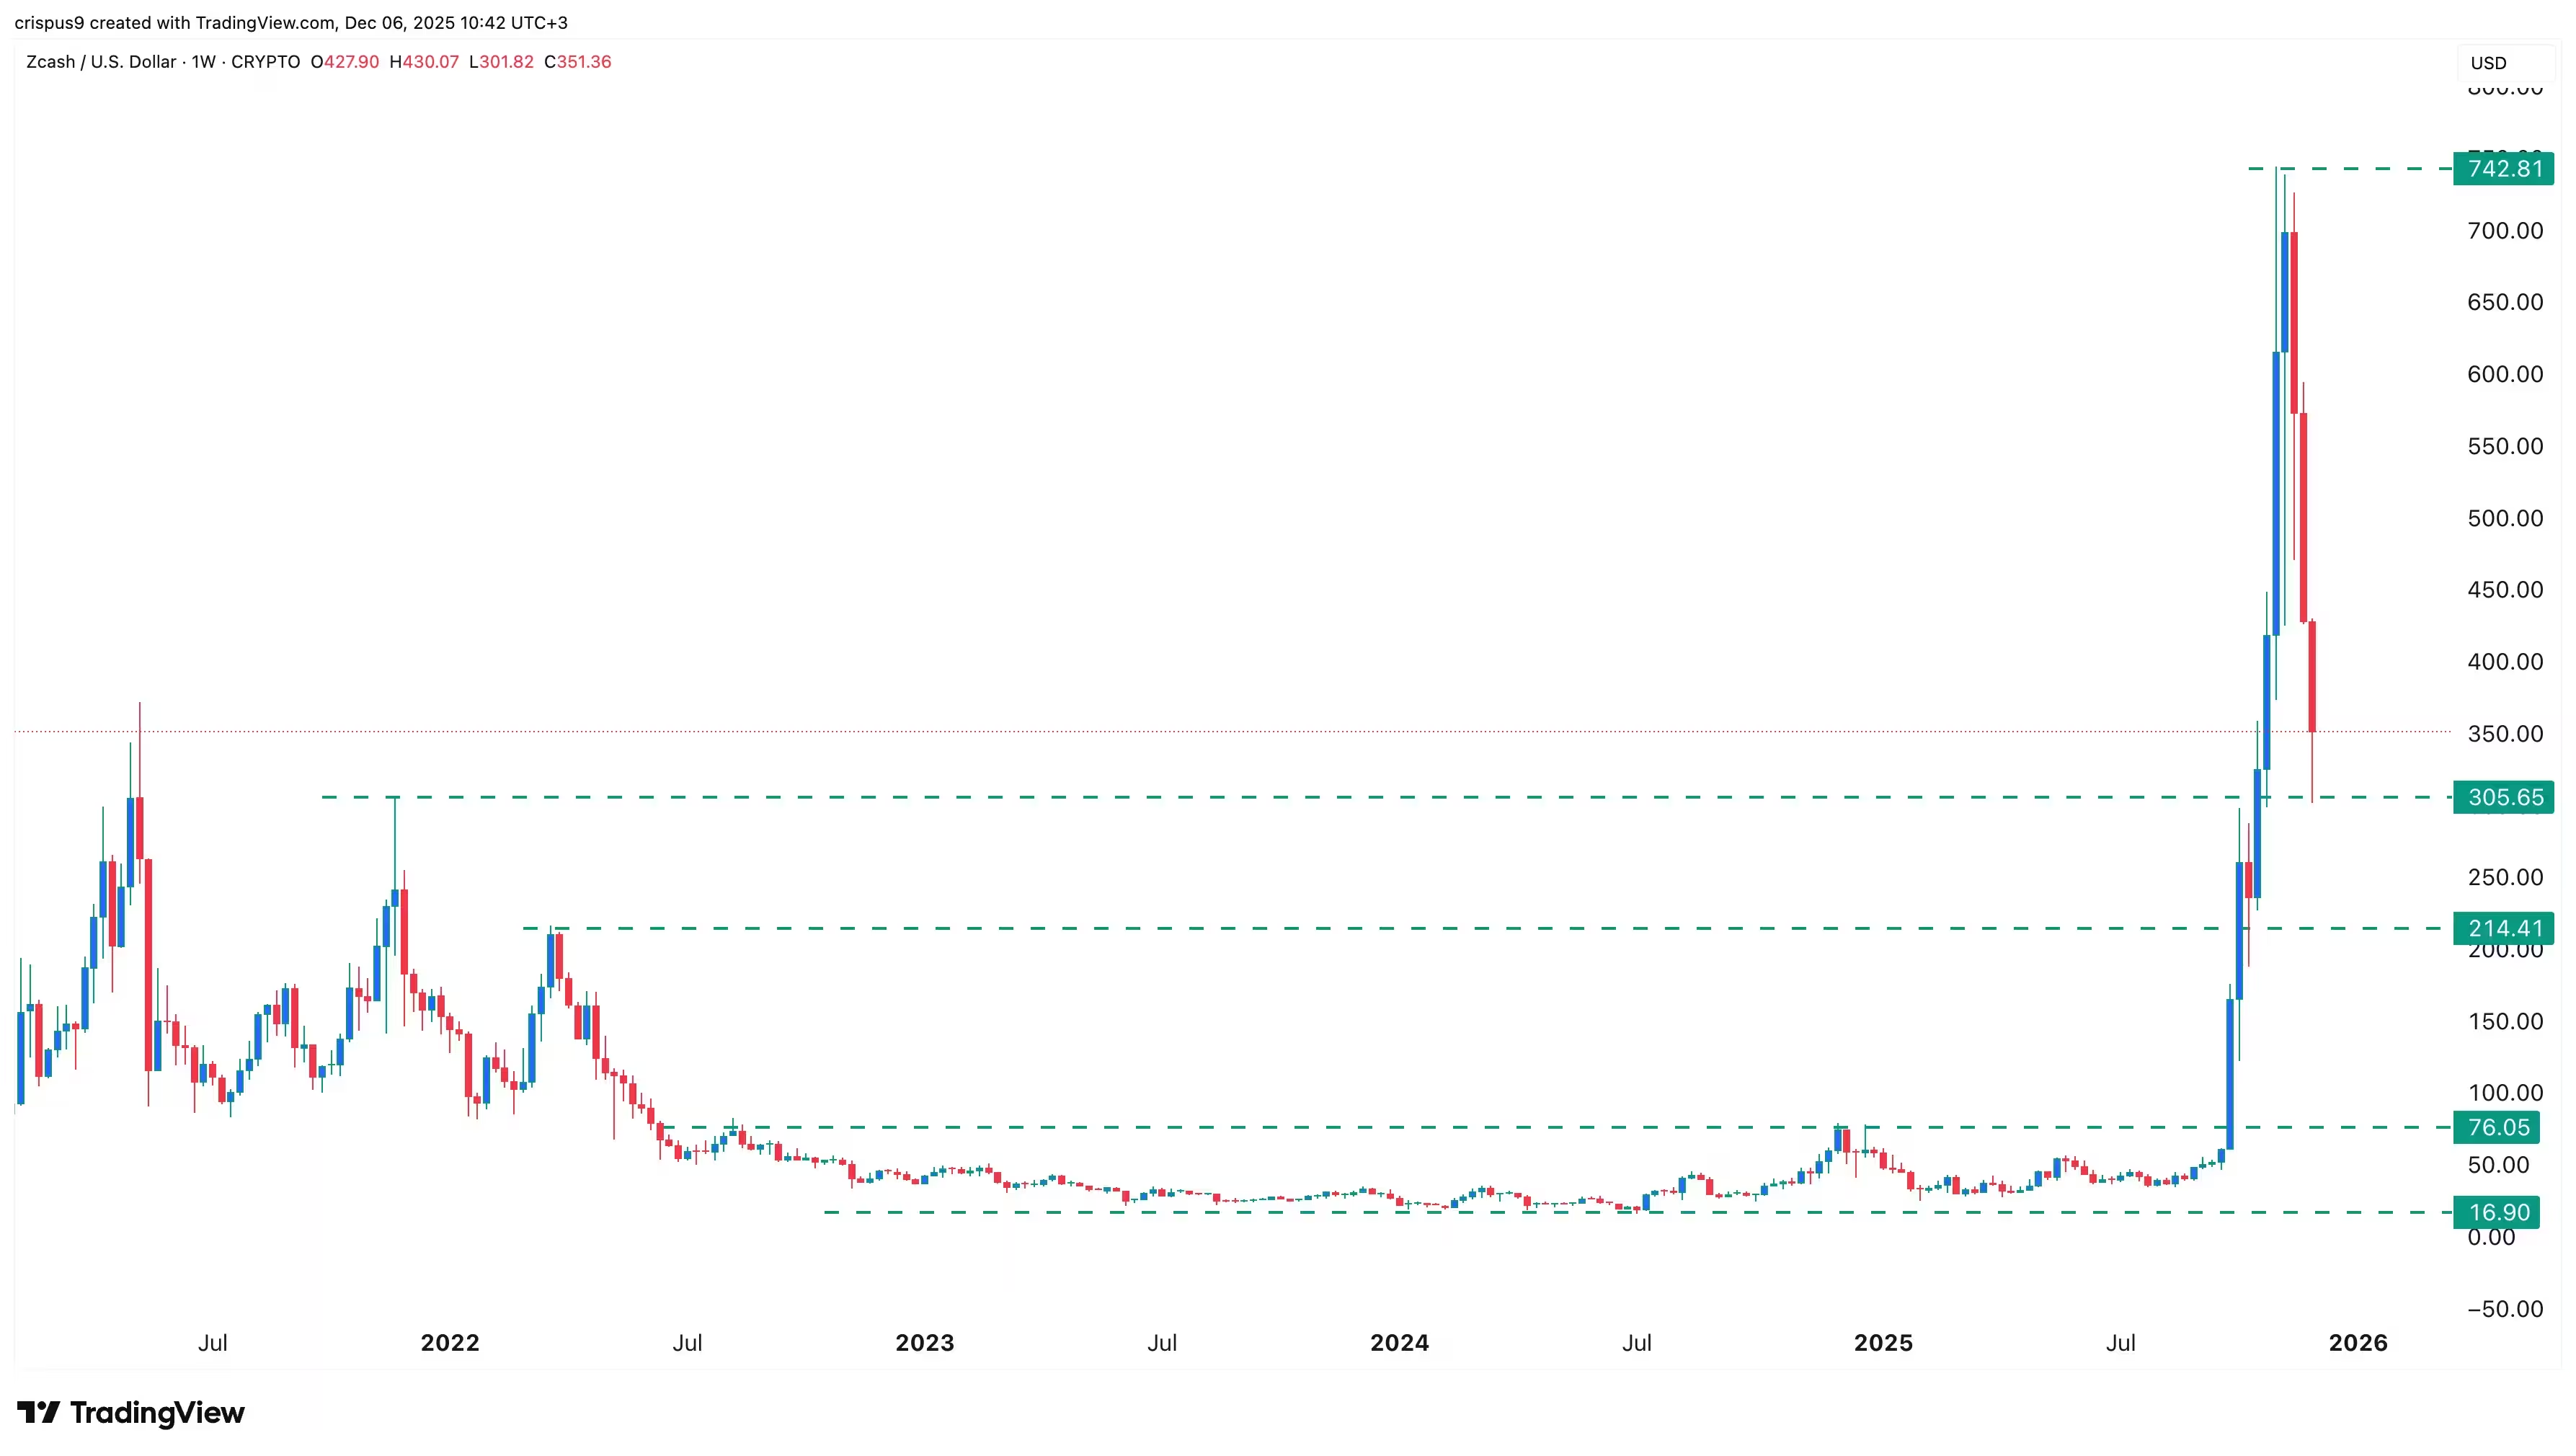
ZEC price chart
Distribution, chart patterns and the markdown phase
At the peak near $740, ZEC formed a double-top-like structure before rolling over. Distribution — where larger holders sell into strength — signaled the transition out of the bullish phase. Price action since then has shown classic bearish confirmation: a sequence of long red candles reminiscent of the “three black crows” pattern and expanding volume on the sell-side, consistent with a Wyckoff markdown.
Support tests and short-term outlook
ZEC has retested near-term support around $305, a level last challenged in late 2021. A bounce ahead of any potential SEC decision on a Grayscale ZEC product could produce a temporary relief rally. However, traders should treat such rebounds cautiously: a dead-cat bounce is common when an asset is in freefall — a brief recovery that precedes another leg down.
If bearish momentum resumes and price decisively breaks below the $305 area, the next significant support zone could be found near prior lows around the low- to mid-hundreds. That would imply further downside for market capitalization and price.
What traders should watch
Key crypto-market signals to monitor include volume profiles during rallies and declines, confirmations of distribution on higher timeframes, and any regulatory news or ETF/Grayscale updates from the SEC. For investors focused on privacy tokens and ZEC specifically, entries during clear accumulation signals with defined risk management are essential in this volatile environment.
Overall, the Wyckoff framework helps explain Zcash’s recent surge and abrupt reversal — a textbook move from a long accumulation into markup, followed by distribution and markdown phases.
Source: crypto
Leave a Comment